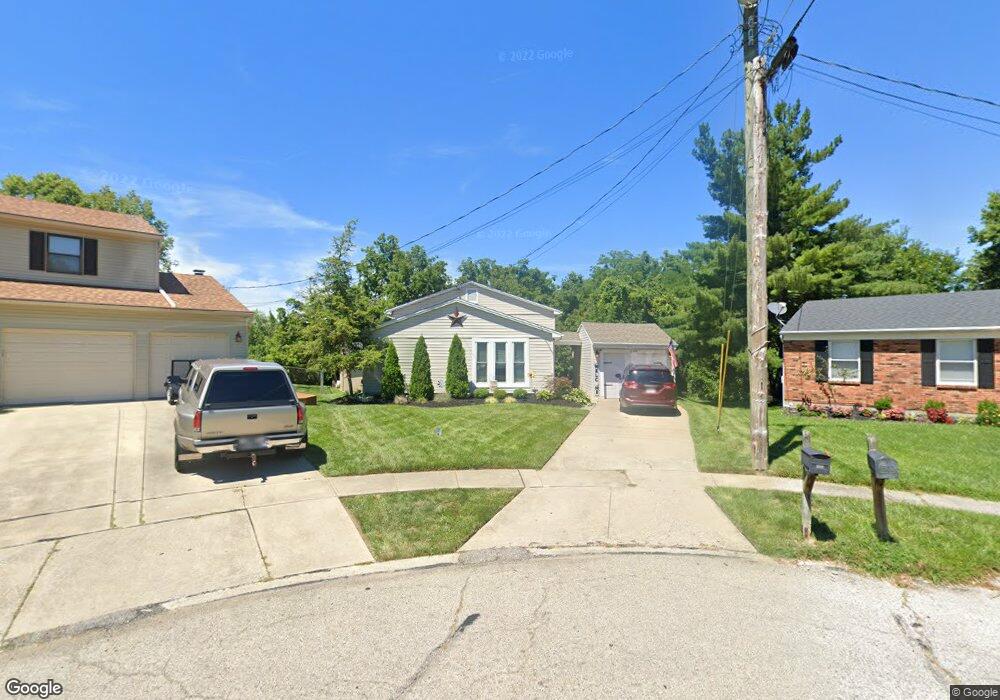
599 Morrvue Dr Cincinnati, OH 45238
Central Delhi NeighborhoodEstimated Value: $247,068 - $287,000
3
Beds
2
Baths
1,556
Sq Ft
$168/Sq Ft
Est. Value
About This Home
This home is located at 599 Morrvue Dr, Cincinnati, OH 45238 and is currently estimated at $261,517, approximately $168 per square foot. 599 Morrvue Dr is a home located in Hamilton County with nearby schools including C.O. Harrison Elementary School, Delhi Middle School, and Oak Hills High School.
Ownership History
Date
Name
Owned For
Owner Type
Purchase Details
Closed on
Jun 9, 2020
Sold by
Plening David Albert and Plening Tricia Marie
Bought by
Clark Amy M and Frederick Timothy L
Current Estimated Value
Home Financials for this Owner
Home Financials are based on the most recent Mortgage that was taken out on this home.
Original Mortgage
$141,391
Outstanding Balance
$125,332
Interest Rate
3.2%
Mortgage Type
FHA
Estimated Equity
$136,185
Purchase Details
Closed on
Jun 16, 2005
Sold by
Johnson Marc D and Johnson Jennifer L
Bought by
Piening David A
Home Financials for this Owner
Home Financials are based on the most recent Mortgage that was taken out on this home.
Original Mortgage
$85,000
Interest Rate
5.69%
Mortgage Type
Fannie Mae Freddie Mac
Purchase Details
Closed on
May 23, 2001
Sold by
Noell David K and Noell Melissa L
Bought by
Johnson Marc D and Panaro Jennifer L
Home Financials for this Owner
Home Financials are based on the most recent Mortgage that was taken out on this home.
Original Mortgage
$121,600
Interest Rate
7.23%
Purchase Details
Closed on
Feb 2, 1995
Sold by
Obert Steven P and Obert Carol L
Bought by
Noell David K and Noell Melissa L
Home Financials for this Owner
Home Financials are based on the most recent Mortgage that was taken out on this home.
Original Mortgage
$62,900
Interest Rate
9.24%
Create a Home Valuation Report for This Property
The Home Valuation Report is an in-depth analysis detailing your home's value as well as a comparison with similar homes in the area
Home Values in the Area
Average Home Value in this Area
Purchase History
| Date | Buyer | Sale Price | Title Company |
|---|---|---|---|
| Clark Amy M | $144,000 | Agility Closing And Ttl Svcs | |
| Piening David A | $138,900 | Old Town Title Agency | |
| Johnson Marc D | $128,000 | -- | |
| Noell David K | -- | -- |
Source: Public Records
Mortgage History
| Date | Status | Borrower | Loan Amount |
|---|---|---|---|
| Open | Clark Amy M | $141,391 | |
| Previous Owner | Piening David A | $85,000 | |
| Previous Owner | Johnson Marc D | $121,600 | |
| Previous Owner | Noell David K | $62,900 |
Source: Public Records
Tax History Compared to Growth
Tax History
| Year | Tax Paid | Tax Assessment Tax Assessment Total Assessment is a certain percentage of the fair market value that is determined by local assessors to be the total taxable value of land and additions on the property. | Land | Improvement |
|---|---|---|---|---|
| 2024 | $4,238 | $69,374 | $10,500 | $58,874 |
| 2023 | $4,175 | $69,374 | $10,500 | $58,874 |
| 2022 | $3,409 | $50,400 | $9,744 | $40,656 |
| 2021 | $3,405 | $50,400 | $9,744 | $40,656 |
| 2020 | $3,371 | $50,400 | $9,744 | $40,656 |
| 2019 | $2,889 | $38,626 | $8,400 | $30,226 |
| 2018 | $2,890 | $38,626 | $8,400 | $30,226 |
| 2017 | $2,650 | $38,626 | $8,400 | $30,226 |
| 2016 | $2,617 | $37,807 | $7,980 | $29,827 |
| 2015 | $2,585 | $37,807 | $7,980 | $29,827 |
| 2014 | $2,584 | $37,807 | $7,980 | $29,827 |
| 2013 | $2,563 | $39,799 | $8,400 | $31,399 |
Source: Public Records
Map
Nearby Homes
- 553 Starling Ct
- 540 Morrvue Dr
- 548 Anderson Ferry Rd
- 5341 Carefree Ct
- 784 Woodyhill Dr
- 464 Happy Dr
- 5449 Dengail Dr
- 949 Anderson Ferry Rd
- 5468 Courier Ct
- 5312 Panther Ct
- 5140 Old Oak Trail Unit 34
- 5176 Dundas Dr
- 5019 Garden Grove Ln
- 621 Covedale Ave
- 5010 Garden Grove Ln
- 5086 Garden Grove Ln
- 5548 Timber Way Dr Unit 5548
- 372 Marbill Ln
- 4996 Donlar Ave
- 815 Neeb Rd