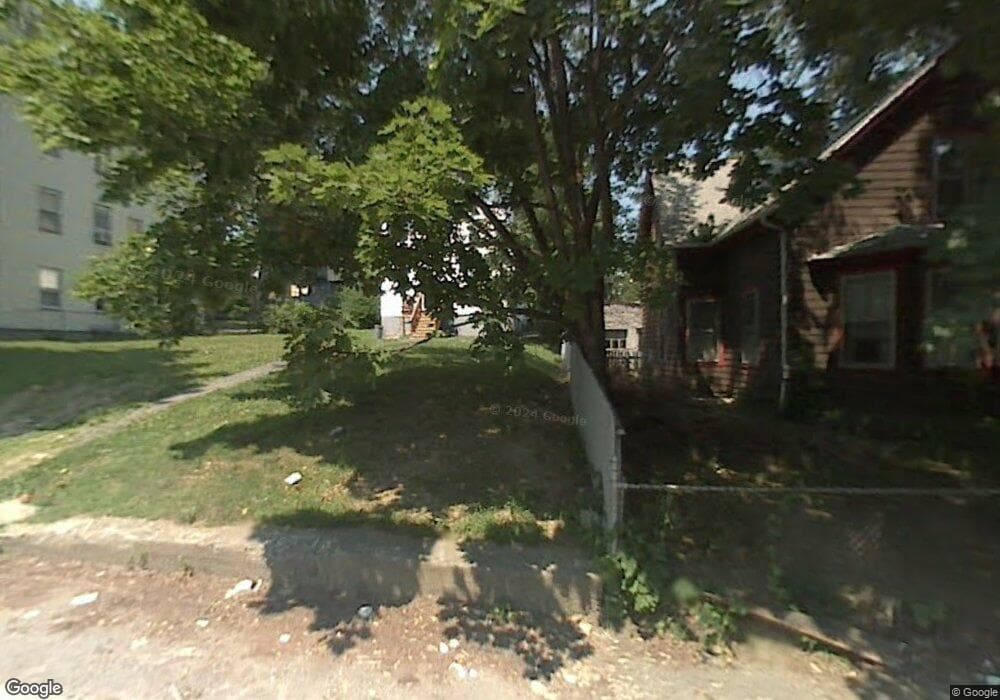
6 Albert St Worcester, MA 01610
Beacon Brightly NeighborhoodEstimated Value: $577,000 - $777,000
6
Beds
3
Baths
3,180
Sq Ft
$206/Sq Ft
Est. Value
About This Home
This home is located at 6 Albert St, Worcester, MA 01610 and is currently estimated at $653,667, approximately $205 per square foot. 6 Albert St is a home located in Worcester County with nearby schools including Goddard School of Science & Technology, Jacob Hiatt Magnet School, and Chandler Magnet.
Ownership History
Date
Name
Owned For
Owner Type
Purchase Details
Closed on
Mar 5, 2021
Sold by
Lmcal Llc
Bought by
Lyons Richard L
Current Estimated Value
Purchase Details
Closed on
Mar 4, 2019
Sold by
Panizek Paul Est
Bought by
Lmcal Llc
Purchase Details
Closed on
Feb 2, 1998
Sold by
Acre Rt and Haims Lori B
Bought by
Parizek Paul
Home Financials for this Owner
Home Financials are based on the most recent Mortgage that was taken out on this home.
Original Mortgage
$55,800
Interest Rate
7.02%
Mortgage Type
Purchase Money Mortgage
Purchase Details
Closed on
Jul 1, 1997
Sold by
Grenier Raymond G
Bought by
Acre Rt and Haims Lori B
Home Financials for this Owner
Home Financials are based on the most recent Mortgage that was taken out on this home.
Original Mortgage
$42,800
Interest Rate
7.81%
Mortgage Type
Purchase Money Mortgage
Create a Home Valuation Report for This Property
The Home Valuation Report is an in-depth analysis detailing your home's value as well as a comparison with similar homes in the area
Home Values in the Area
Average Home Value in this Area
Purchase History
| Date | Buyer | Sale Price | Title Company |
|---|---|---|---|
| Lyons Richard L | -- | None Available | |
| Lmcal Llc | $125,000 | -- | |
| Parizek Paul | $62,000 | -- | |
| Acre Rt | $35,000 | -- |
Source: Public Records
Mortgage History
| Date | Status | Borrower | Loan Amount |
|---|---|---|---|
| Previous Owner | Acre Rt | $55,800 | |
| Previous Owner | Acre Rt | $42,800 |
Source: Public Records
Tax History
| Year | Tax Paid | Tax Assessment Tax Assessment Total Assessment is a certain percentage of the fair market value that is determined by local assessors to be the total taxable value of land and additions on the property. | Land | Improvement |
|---|---|---|---|---|
| 2025 | $6,426 | $487,200 | $64,900 | $422,300 |
| 2024 | $5,911 | $429,900 | $64,900 | $365,000 |
| 2023 | $5,593 | $390,000 | $51,300 | $338,700 |
| 2022 | $4,869 | $320,100 | $41,000 | $279,100 |
| 2021 | $4,257 | $261,500 | $32,800 | $228,700 |
| 2020 | $3,927 | $231,000 | $32,800 | $198,200 |
| 2019 | $3,524 | $195,800 | $31,300 | $164,500 |
| 2018 | $3,442 | $182,000 | $31,300 | $150,700 |
| 2017 | $3,225 | $167,800 | $31,300 | $136,500 |
| 2016 | $3,056 | $148,300 | $21,500 | $126,800 |
| 2015 | $2,976 | $148,300 | $21,500 | $126,800 |
| 2014 | $2,898 | $148,300 | $21,500 | $126,800 |
Source: Public Records
Map
Nearby Homes
Your Personal Tour Guide
Ask me questions while you tour the home.