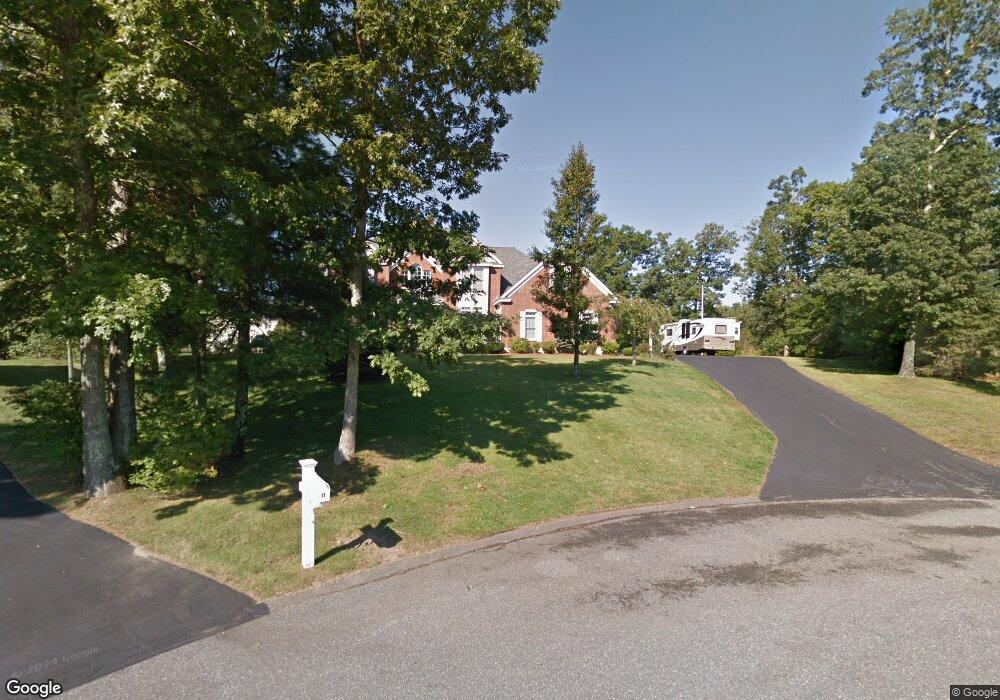
6 Apollo Way Salem, NH 03079
Wheelers Mill NeighborhoodEstimated Value: $1,176,000 - $1,504,000
4
Beds
4
Baths
6,051
Sq Ft
$221/Sq Ft
Est. Value
About This Home
This home is located at 6 Apollo Way, Salem, NH 03079 and is currently estimated at $1,339,322, approximately $221 per square foot. 6 Apollo Way is a home located in Rockingham County with nearby schools including North Salem Elementary School, Woodbury School, and Salem High School.
Ownership History
Date
Name
Owned For
Owner Type
Purchase Details
Closed on
Sep 5, 2003
Sold by
Yetman Christopher S and Yetman Margery E
Bought by
Hajnasr Anthony and Hajnasr Elissar
Current Estimated Value
Home Financials for this Owner
Home Financials are based on the most recent Mortgage that was taken out on this home.
Original Mortgage
$550,000
Outstanding Balance
$251,278
Interest Rate
6.02%
Estimated Equity
$1,088,044
Purchase Details
Closed on
Jan 13, 1999
Sold by
Hampshire Ventures Inc
Bought by
Yetman Christopher S and Yetman Margery E
Home Financials for this Owner
Home Financials are based on the most recent Mortgage that was taken out on this home.
Original Mortgage
$59,900
Interest Rate
6.7%
Create a Home Valuation Report for This Property
The Home Valuation Report is an in-depth analysis detailing your home's value as well as a comparison with similar homes in the area
Home Values in the Area
Average Home Value in this Area
Purchase History
| Date | Buyer | Sale Price | Title Company |
|---|---|---|---|
| Hajnasr Anthony | $699,900 | -- | |
| Yetman Christopher S | $114,900 | -- |
Source: Public Records
Mortgage History
| Date | Status | Borrower | Loan Amount |
|---|---|---|---|
| Open | Yetman Christopher S | $312,000 | |
| Open | Yetman Christopher S | $550,000 | |
| Previous Owner | Yetman Christopher S | $59,900 |
Source: Public Records
Tax History
| Year | Tax Paid | Tax Assessment Tax Assessment Total Assessment is a certain percentage of the fair market value that is determined by local assessors to be the total taxable value of land and additions on the property. | Land | Improvement |
|---|---|---|---|---|
| 2024 | $17,727 | $1,007,200 | $238,100 | $769,100 |
| 2023 | $17,082 | $1,007,200 | $238,100 | $769,100 |
| 2022 | $16,166 | $1,007,200 | $238,100 | $769,100 |
| 2021 | $15,290 | $956,800 | $238,100 | $718,700 |
| 2020 | $14,628 | $664,300 | $170,000 | $494,300 |
| 2019 | $14,601 | $664,300 | $170,000 | $494,300 |
| 2018 | $14,356 | $664,300 | $170,000 | $494,300 |
| 2017 | $13,844 | $664,300 | $170,000 | $494,300 |
| 2016 | $13,572 | $664,300 | $170,000 | $494,300 |
| 2015 | $12,969 | $606,300 | $168,200 | $438,100 |
| 2014 | $12,605 | $606,300 | $168,200 | $438,100 |
| 2013 | $12,405 | $606,300 | $168,200 | $438,100 |
Source: Public Records
Map
Nearby Homes
- 55A Millville Cir
- 182 Shore Dr
- 1 Kimball Ave
- 27 London Rd
- 29 London Rd
- 4 Therriault Ave
- 8 Stoneybrook Ln
- 17 Cole Rd
- 60 Shore Dr
- 3 Longview Dr Unit 305
- 1 Longview Dr Unit 110
- 1 Longview Dr Unit 203
- 1 Longview Dr Unit 101
- 1 Longview Dr Unit 108
- 1 Longview Dr Unit 401
- 1 Longview Dr Unit 306
- 1 Longview Dr Unit 205
- 1 Longview Dr Unit 106
- 1 Longview Dr Unit 210
- 8 Alta Ave
Your Personal Tour Guide
Ask me questions while you tour the home.