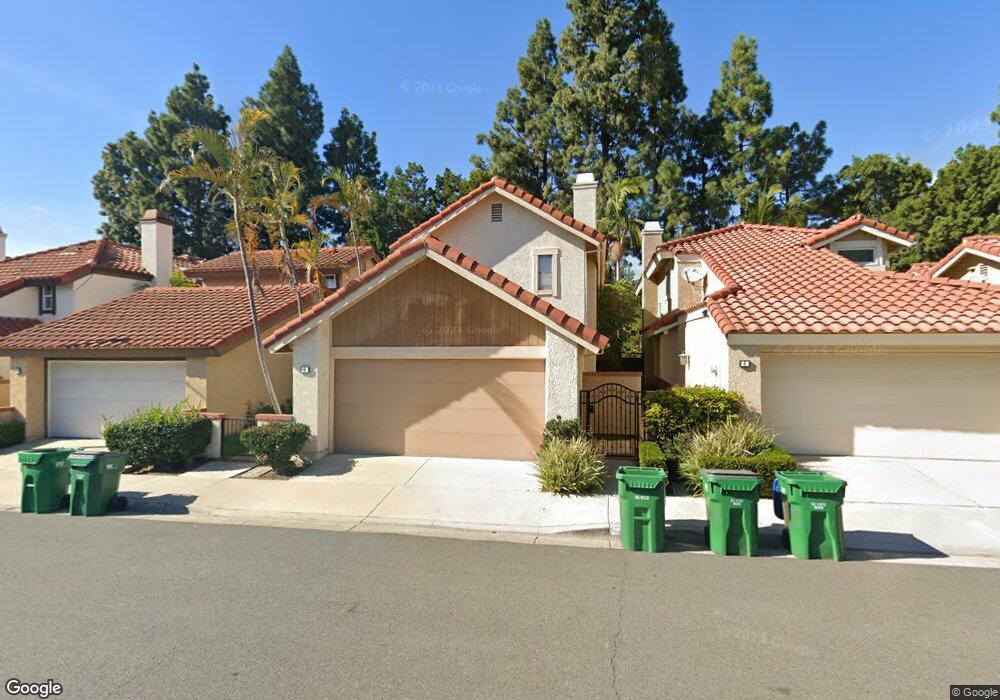
6 Avellino Irvine, CA 92620
Northwood NeighborhoodEstimated Value: $1,314,806 - $1,406,000
3
Beds
3
Baths
1,645
Sq Ft
$831/Sq Ft
Est. Value
About This Home
This home is located at 6 Avellino, Irvine, CA 92620 and is currently estimated at $1,366,952, approximately $830 per square foot. 6 Avellino is a home located in Orange County with nearby schools including Brywood Elementary School, Sierra Vista Middle School, and Northwood High School.
Ownership History
Date
Name
Owned For
Owner Type
Purchase Details
Closed on
May 29, 2015
Sold by
Wang Henry C and Hsiao Pamela I
Bought by
The Henry Wang & Pamela Hsiao Revocable
Current Estimated Value
Purchase Details
Closed on
Aug 11, 1997
Sold by
Hsiao Ray J
Bought by
Hsiao Pamela I
Home Financials for this Owner
Home Financials are based on the most recent Mortgage that was taken out on this home.
Original Mortgage
$150,000
Outstanding Balance
$22,622
Interest Rate
7.61%
Estimated Equity
$1,344,330
Purchase Details
Closed on
Aug 8, 1997
Sold by
Hsiao Pamela I
Bought by
Wang Henry C and Hsiao Pamela I
Home Financials for this Owner
Home Financials are based on the most recent Mortgage that was taken out on this home.
Original Mortgage
$150,000
Outstanding Balance
$22,622
Interest Rate
7.61%
Estimated Equity
$1,344,330
Create a Home Valuation Report for This Property
The Home Valuation Report is an in-depth analysis detailing your home's value as well as a comparison with similar homes in the area
Home Values in the Area
Average Home Value in this Area
Purchase History
| Date | Buyer | Sale Price | Title Company |
|---|---|---|---|
| The Henry Wang & Pamela Hsiao Revocable | -- | None Available | |
| Hsiao Pamela I | -- | South Coast Title Company | |
| Wang Henry C | -- | South Coast Title Company |
Source: Public Records
Mortgage History
| Date | Status | Borrower | Loan Amount |
|---|---|---|---|
| Open | Wang Henry C | $150,000 |
Source: Public Records
Tax History Compared to Growth
Tax History
| Year | Tax Paid | Tax Assessment Tax Assessment Total Assessment is a certain percentage of the fair market value that is determined by local assessors to be the total taxable value of land and additions on the property. | Land | Improvement |
|---|---|---|---|---|
| 2025 | $3,769 | $345,029 | $167,423 | $177,606 |
| 2024 | $3,769 | $338,264 | $164,140 | $174,124 |
| 2023 | $3,672 | $331,632 | $160,922 | $170,710 |
| 2022 | $3,597 | $325,130 | $157,767 | $167,363 |
| 2021 | $3,513 | $318,755 | $154,673 | $164,082 |
| 2020 | $3,493 | $315,487 | $153,087 | $162,400 |
| 2019 | $3,416 | $309,301 | $150,085 | $159,216 |
| 2018 | $3,354 | $303,237 | $147,142 | $156,095 |
| 2017 | $3,285 | $297,292 | $144,257 | $153,035 |
| 2016 | $3,145 | $291,463 | $141,428 | $150,035 |
| 2015 | $3,098 | $287,085 | $139,303 | $147,782 |
| 2014 | -- | $281,462 | $136,574 | $144,888 |
Source: Public Records
Map
Nearby Homes