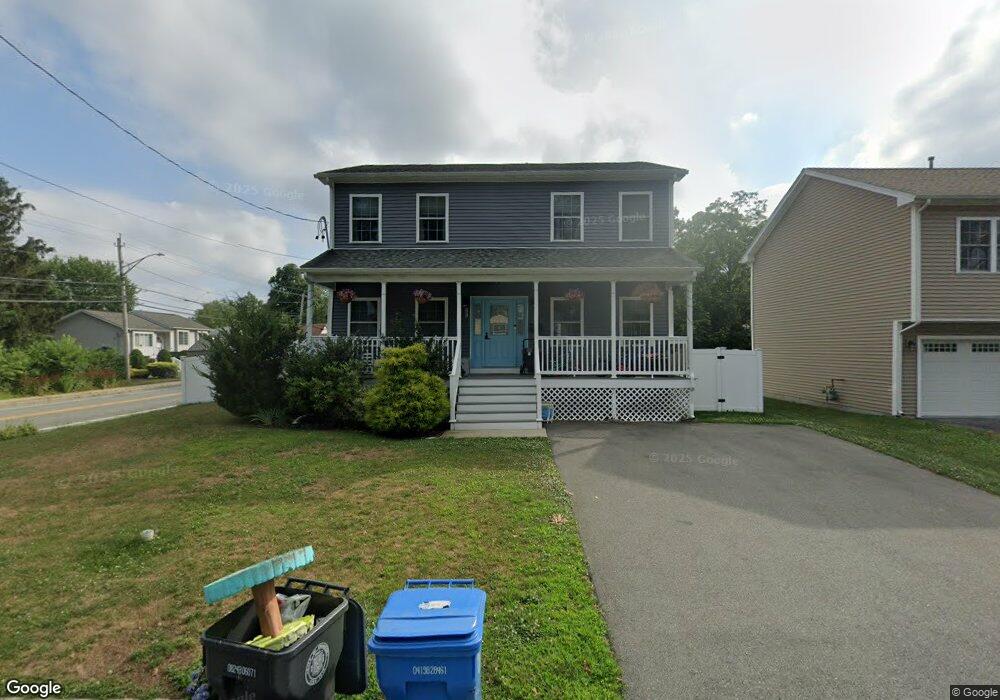
6 Bicknell Ave Cranston, RI 02920
Mayfield NeighborhoodEstimated Value: $525,000 - $610,000
3
Beds
3
Baths
1,904
Sq Ft
$294/Sq Ft
Est. Value
About This Home
This home is located at 6 Bicknell Ave, Cranston, RI 02920 and is currently estimated at $560,112, approximately $294 per square foot. 6 Bicknell Ave is a home with nearby schools including Garden City School, Western Hills Middle School, and Cranston High School West.
Ownership History
Date
Name
Owned For
Owner Type
Purchase Details
Closed on
May 3, 2019
Sold by
Cnj Realty Llc
Bought by
Rachdouni Raffi A and Rachdouni Bethany
Current Estimated Value
Home Financials for this Owner
Home Financials are based on the most recent Mortgage that was taken out on this home.
Original Mortgage
$270,000
Outstanding Balance
$236,895
Interest Rate
4.2%
Mortgage Type
Purchase Money Mortgage
Estimated Equity
$323,217
Purchase Details
Closed on
Jul 7, 2017
Sold by
Cnj Realty Llc
Bought by
Iacaponi Briana
Home Financials for this Owner
Home Financials are based on the most recent Mortgage that was taken out on this home.
Original Mortgage
$284,050
Interest Rate
3.95%
Mortgage Type
Purchase Money Mortgage
Purchase Details
Closed on
Sep 16, 2016
Sold by
Morr Realty Llc
Bought by
Cnj Realty Llc
Create a Home Valuation Report for This Property
The Home Valuation Report is an in-depth analysis detailing your home's value as well as a comparison with similar homes in the area
Home Values in the Area
Average Home Value in this Area
Purchase History
| Date | Buyer | Sale Price | Title Company |
|---|---|---|---|
| Rachdouni Raffi A | $300,000 | -- | |
| Iacaponi Briana | $299,000 | -- | |
| Cnj Realty Llc | $40,000 | -- |
Source: Public Records
Mortgage History
| Date | Status | Borrower | Loan Amount |
|---|---|---|---|
| Open | Rachdouni Raffi A | $270,000 | |
| Previous Owner | Cnj Realty Llc | $284,050 |
Source: Public Records
Tax History Compared to Growth
Tax History
| Year | Tax Paid | Tax Assessment Tax Assessment Total Assessment is a certain percentage of the fair market value that is determined by local assessors to be the total taxable value of land and additions on the property. | Land | Improvement |
|---|---|---|---|---|
| 2025 | $6,313 | $454,800 | $89,000 | $365,800 |
| 2024 | $6,190 | $454,800 | $89,000 | $365,800 |
| 2023 | $6,417 | $339,500 | $61,400 | $278,100 |
| 2022 | $6,284 | $339,500 | $61,400 | $278,100 |
| 2021 | $6,111 | $339,500 | $61,400 | $278,100 |
| 2020 | $5,666 | $272,800 | $47,800 | $225,000 |
| 2019 | $5,666 | $272,800 | $47,800 | $225,000 |
| 2018 | $970 | $47,800 | $47,800 | $0 |
| 2017 | $860 | $37,500 | $37,500 | $0 |
| 2016 | $842 | $37,500 | $37,500 | $0 |
| 2015 | $842 | $37,500 | $37,500 | $0 |
| 2014 | $857 | $37,500 | $37,500 | $0 |
Source: Public Records
Map
Nearby Homes