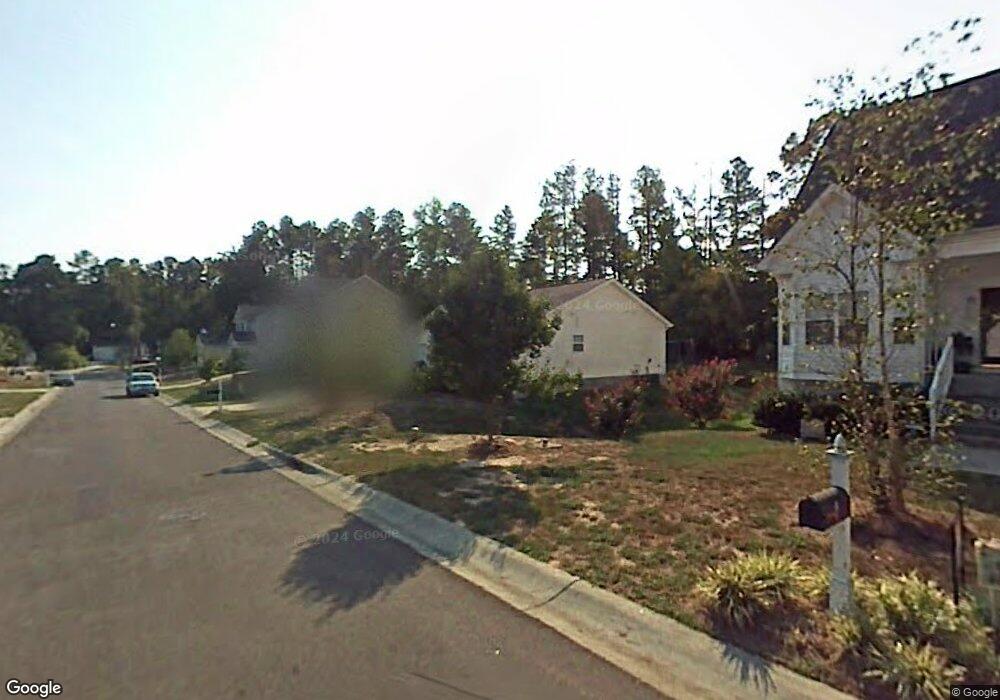
6 Birds Nest Ct Durham, NC 27703
Eastern Durham NeighborhoodEstimated Value: $297,000 - $330,000
3
Beds
2
Baths
1,090
Sq Ft
$287/Sq Ft
Est. Value
About This Home
This home is located at 6 Birds Nest Ct, Durham, NC 27703 and is currently estimated at $312,829, approximately $286 per square foot. 6 Birds Nest Ct is a home located in Durham County with nearby schools including Glenn Elementary, John W Neal Middle School, and Southern School of Energy & Sustainability.
Ownership History
Date
Name
Owned For
Owner Type
Purchase Details
Closed on
Aug 23, 2017
Sold by
White Stephen C and White Shanda W
Bought by
White Stepehn C
Current Estimated Value
Home Financials for this Owner
Home Financials are based on the most recent Mortgage that was taken out on this home.
Original Mortgage
$119,999
Outstanding Balance
$100,318
Interest Rate
4.03%
Mortgage Type
New Conventional
Estimated Equity
$212,511
Purchase Details
Closed on
Dec 14, 2004
Sold by
Skylur Homes Inc
Bought by
White Stephen C and White Shanda W
Home Financials for this Owner
Home Financials are based on the most recent Mortgage that was taken out on this home.
Original Mortgage
$104,480
Interest Rate
5.95%
Mortgage Type
Purchase Money Mortgage
Purchase Details
Closed on
Mar 12, 2004
Sold by
Jl Development Custom Homes Llc
Bought by
Skylur Homes Inc
Home Financials for this Owner
Home Financials are based on the most recent Mortgage that was taken out on this home.
Original Mortgage
$29,054
Interest Rate
5.53%
Mortgage Type
Purchase Money Mortgage
Create a Home Valuation Report for This Property
The Home Valuation Report is an in-depth analysis detailing your home's value as well as a comparison with similar homes in the area
Home Values in the Area
Average Home Value in this Area
Purchase History
| Date | Buyer | Sale Price | Title Company |
|---|---|---|---|
| White Stepehn C | -- | None Available | |
| White Stephen C | $131,000 | -- | |
| Skylur Homes Inc | $28,000 | -- |
Source: Public Records
Mortgage History
| Date | Status | Borrower | Loan Amount |
|---|---|---|---|
| Open | White Stepehn C | $119,999 | |
| Closed | White Stephen C | $104,480 | |
| Previous Owner | Skylur Homes Inc | $29,054 | |
| Closed | White Stephen C | $26,140 |
Source: Public Records
Tax History Compared to Growth
Tax History
| Year | Tax Paid | Tax Assessment Tax Assessment Total Assessment is a certain percentage of the fair market value that is determined by local assessors to be the total taxable value of land and additions on the property. | Land | Improvement |
|---|---|---|---|---|
| 2025 | $2,293 | $315,418 | $59,520 | $255,898 |
| 2024 | $2,293 | $164,354 | $25,680 | $138,674 |
| 2023 | $2,153 | $164,354 | $25,680 | $138,674 |
| 2022 | $2,104 | $164,354 | $25,680 | $138,674 |
| 2021 | $2,094 | $164,354 | $25,680 | $138,674 |
| 2020 | $2,044 | $164,354 | $25,680 | $138,674 |
| 2019 | $2,044 | $164,354 | $25,680 | $138,674 |
| 2018 | $1,686 | $124,313 | $31,950 | $92,363 |
| 2017 | $1,674 | $124,313 | $31,950 | $92,363 |
| 2016 | $1,617 | $124,313 | $31,950 | $92,363 |
| 2015 | $1,859 | $134,262 | $31,351 | $102,911 |
| 2014 | $1,859 | $134,262 | $31,351 | $102,911 |
Source: Public Records
Map
Nearby Homes
- 2 Tarrywood Ct
- 214 Cloverdale Dr
- 4918 Tyne Dr
- 4807 Tyne Dr
- 4 N Berrymeadow Ln
- 31 S Angela Cir
- 3801 Tyne Dr
- 110 Knightwood Dr
- 5409 Hadrian Dr
- 59 Enesco Cir
- 512 Magna Dr
- 1060 Gentle Reed Dr
- 509 Pebblestone Dr
- 1114 Kindness Ln
- 721 Pebblestone Dr
- 1103 Kindness Ln
- 3507 Portico Ln
- 1143 Sweet Cream Ct
- 3615 Freeman Rd
- 1104 Pebblestone Dr
- 4 Birds Nest Ct
- 8 Birds Nest Ct
- 10 Birds Nest Ct
- 203 Adlett Ln
- 5 Birds Nest Ct
- 3 Birds Nest Ct
- 7 Birds Nest Ct
- 2 Birds Nest Ct
- 119 Adlett Ln
- 201 Adlett Ln
- 1122 N Mineral Springs Rd
- 12 Birds Nest Ct
- 9 Birds Nest Ct
- 1114 N Mineral Springs Rd
- 117 Adlett Ln
- 4 Lost Tree Ct
- 1112 N Mineral Springs Rd
- 6 Lost Tree Ct
- 11 Birds Nest Ct
- 8 Lost Tree Ct