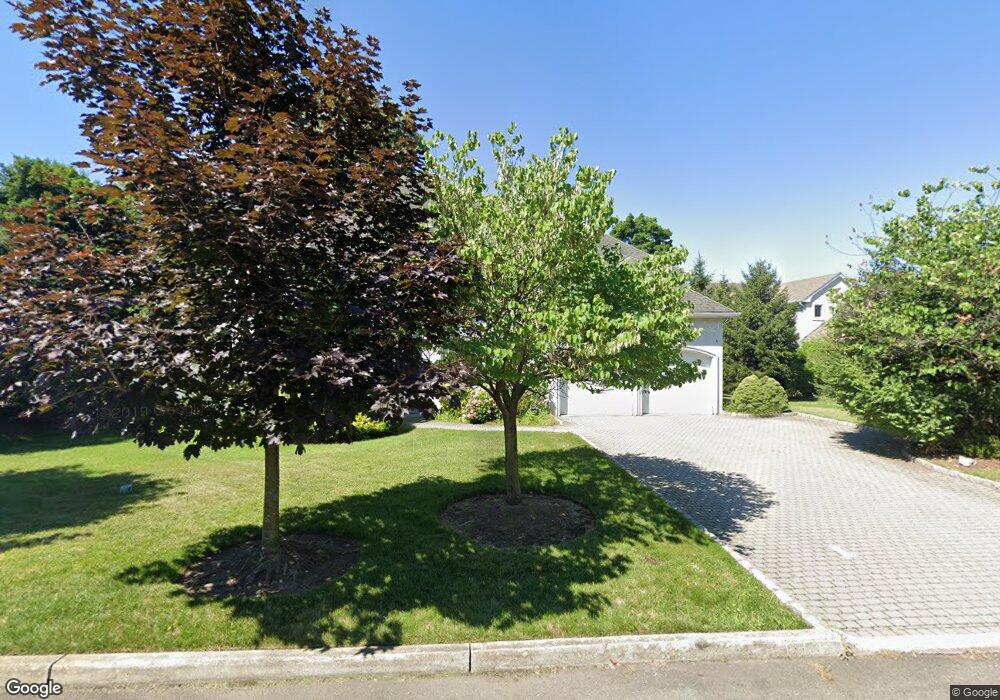
6 Blackledge Ct Closter, NJ 07624
Estimated Value: $2,185,000 - $2,954,000
Studio
--
Bath
4,400
Sq Ft
$552/Sq Ft
Est. Value
About This Home
This home is located at 6 Blackledge Ct, Closter, NJ 07624 and is currently estimated at $2,427,051, approximately $551 per square foot. 6 Blackledge Ct is a home located in Bergen County with nearby schools including Hillside Elementary School, Tenakill Middle School, and Northern Valley Regional High School at Demarest.
Ownership History
Date
Name
Owned For
Owner Type
Purchase Details
Closed on
Sep 30, 2002
Sold by
Simon Jeremy
Bought by
Goldman Benjamin and Goldman Allysa
Current Estimated Value
Home Financials for this Owner
Home Financials are based on the most recent Mortgage that was taken out on this home.
Original Mortgage
$850,000
Outstanding Balance
$358,699
Interest Rate
6.25%
Estimated Equity
$2,068,352
Purchase Details
Closed on
Apr 26, 2002
Sold by
Walker Rob
Bought by
Shafel Nayel and Sharaan Mona
Home Financials for this Owner
Home Financials are based on the most recent Mortgage that was taken out on this home.
Original Mortgage
$1,000,000
Interest Rate
7.13%
Purchase Details
Closed on
Aug 31, 2001
Sold by
Landi Joseph
Bought by
Walker Rob
Home Financials for this Owner
Home Financials are based on the most recent Mortgage that was taken out on this home.
Original Mortgage
$850,000
Interest Rate
6.89%
Purchase Details
Closed on
Nov 7, 1997
Sold by
Winstar Financial Service Inc
Bought by
Landi Joseph and Landi Nana
Create a Home Valuation Report for This Property
The Home Valuation Report is an in-depth analysis detailing your home's value as well as a comparison with similar homes in the area
Home Values in the Area
Average Home Value in this Area
Purchase History
| Date | Buyer | Sale Price | Title Company |
|---|---|---|---|
| Goldman Benjamin | $1,380,000 | -- | |
| Shafel Nayel | $1,250,000 | -- | |
| Walker Rob | $1,200,000 | -- | |
| Landi Joseph | $310,000 | -- |
Source: Public Records
Mortgage History
| Date | Status | Borrower | Loan Amount |
|---|---|---|---|
| Open | Goldman Benjamin | $850,000 | |
| Previous Owner | Shafel Nayel | $1,000,000 | |
| Previous Owner | Walker Rob | $850,000 |
Source: Public Records
Tax History
| Year | Tax Paid | Tax Assessment Tax Assessment Total Assessment is a certain percentage of the fair market value that is determined by local assessors to be the total taxable value of land and additions on the property. | Land | Improvement |
|---|---|---|---|---|
| 2025 | $35,809 | $1,858,000 | $804,500 | $1,053,500 |
| 2024 | $30,181 | $1,692,300 | $705,000 | $987,300 |
| 2023 | $29,495 | $1,407,700 | $625,000 | $782,700 |
| 2022 | $29,495 | $1,333,400 | $588,500 | $744,900 |
| 2021 | $29,729 | $1,290,300 | $566,000 | $724,300 |
| 2020 | $29,084 | $1,297,800 | $568,000 | $729,800 |
| 2019 | $28,515 | $1,286,200 | $561,000 | $725,200 |
| 2018 | $28,208 | $1,267,200 | $553,000 | $714,200 |
| 2017 | $30,693 | $1,345,000 | $527,300 | $817,700 |
| 2016 | $30,115 | $1,345,000 | $527,300 | $817,700 |
| 2015 | $29,456 | $1,345,000 | $527,300 | $817,700 |
| 2014 | $28,635 | $1,345,000 | $527,300 | $817,700 |
Source: Public Records
Map
Nearby Homes
- 8 Ranch Ln
- 22 Maplewood Rd
- 520 Homans Ave
- 12 Cambridge Way
- 379 Anderson Ave
- 14 O Shaughnessy Ln
- 16 Poplar Rd
- 91 Macarthur Ave
- 32 Litchfield Way
- 353 Homans Ave
- 56 Arnold Ave
- 114 Bellaire Dr
- 311 Bellaire Dr
- 543 Closter Dock Rd
- 1 Stone Bridge Ct
- 34 Cambridge Way
- 6 Stone Bridge Ct
- 38 Cambridge Way
- 28 Buckingham Dr
- 36 Marie Major Dr
- 4 Blackledge Ct
- 8 Blackledge Ct
- 10 Blackledge Ct
- 5 Blackledge Ct
- 3 Blackledge Ct
- 765 Closter Dock Rd
- 2 Blackledge Ct
- 1 Blackledge Ct
- 9 Blackledge Ct
- 514 Anderson Ave
- 751 Closter Dock Rd
- 753 Closter Dock Rd
- 761 Closter Dock Rd
- 763 Closter Dock Rd
- 490 Anderson Ave
- 13 Arthur Ct
- 779 Closter Dock Rd
- 12 Ranch Ln
- 18 Jason Woods Rd
- 12 Arthur Ct
Your Personal Tour Guide
Ask me questions while you tour the home.