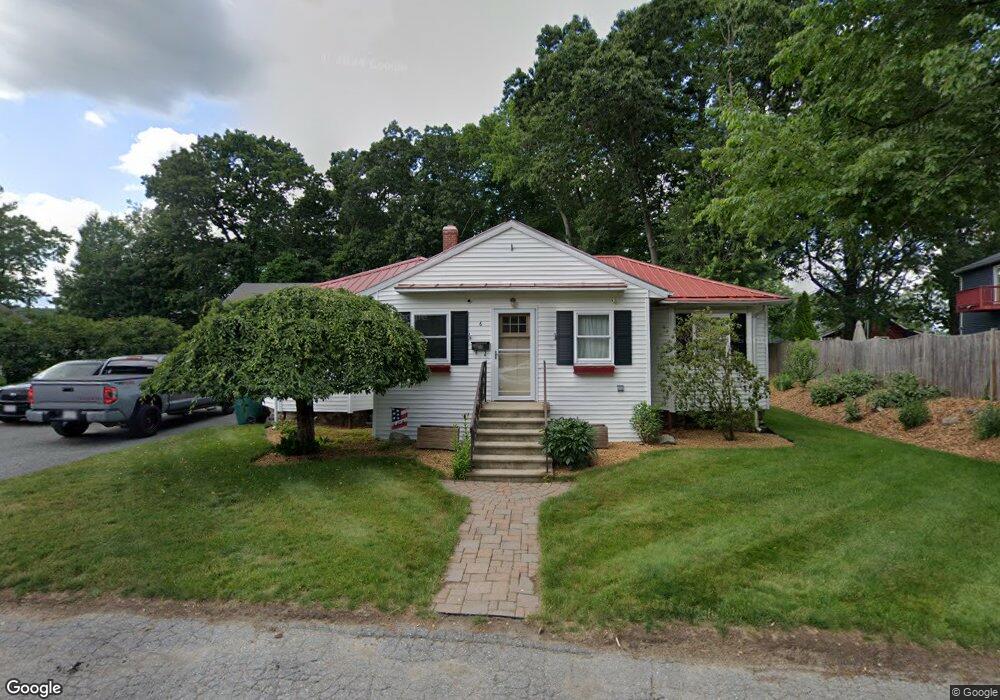
6 Bylund Ave Auburn, MA 01501
Stoneville NeighborhoodEstimated Value: $426,790 - $456,000
3
Beds
3
Baths
1,352
Sq Ft
$325/Sq Ft
Est. Value
About This Home
This home is located at 6 Bylund Ave, Auburn, MA 01501 and is currently estimated at $439,948, approximately $325 per square foot. 6 Bylund Ave is a home located in Worcester County with nearby schools including Auburn Senior High School and Shrewsbury Montessori School - Auburn Campus.
Ownership History
Date
Name
Owned For
Owner Type
Purchase Details
Closed on
May 31, 2000
Sold by
Kozaczka Sophie
Bought by
Dyson Daniel P
Current Estimated Value
Home Financials for this Owner
Home Financials are based on the most recent Mortgage that was taken out on this home.
Original Mortgage
$140,450
Interest Rate
8.14%
Mortgage Type
Purchase Money Mortgage
Purchase Details
Closed on
Feb 2, 1999
Sold by
Ellis Albion G Est and Palmer Barbara A
Bought by
Kozaczka Sophie
Create a Home Valuation Report for This Property
The Home Valuation Report is an in-depth analysis detailing your home's value as well as a comparison with similar homes in the area
Home Values in the Area
Average Home Value in this Area
Purchase History
| Date | Buyer | Sale Price | Title Company |
|---|---|---|---|
| Dyson Daniel P | $137,700 | -- | |
| Kozaczka Sophie | $40,000 | -- |
Source: Public Records
Mortgage History
| Date | Status | Borrower | Loan Amount |
|---|---|---|---|
| Open | Kozaczka Sophie | $170,950 | |
| Closed | Kozaczka Sophie | $142,850 | |
| Closed | Kozaczka Sophie | $140,450 |
Source: Public Records
Tax History Compared to Growth
Tax History
| Year | Tax Paid | Tax Assessment Tax Assessment Total Assessment is a certain percentage of the fair market value that is determined by local assessors to be the total taxable value of land and additions on the property. | Land | Improvement |
|---|---|---|---|---|
| 2025 | $50 | $351,000 | $115,100 | $235,900 |
| 2024 | $4,869 | $326,100 | $109,800 | $216,300 |
| 2023 | $4,694 | $295,600 | $99,800 | $195,800 |
| 2022 | $4,405 | $261,900 | $99,800 | $162,100 |
| 2021 | $3,170 | $225,800 | $88,100 | $137,700 |
| 2020 | $3,212 | $225,800 | $88,100 | $137,700 |
| 2019 | $4,005 | $217,400 | $87,200 | $130,200 |
| 2018 | $3,782 | $205,100 | $81,600 | $123,500 |
| 2017 | $3,622 | $197,500 | $74,000 | $123,500 |
| 2016 | $3,211 | $177,500 | $77,400 | $100,100 |
| 2015 | $3,008 | $174,300 | $77,400 | $96,900 |
| 2014 | $2,820 | $163,100 | $73,600 | $89,500 |
Source: Public Records
Map
Nearby Homes