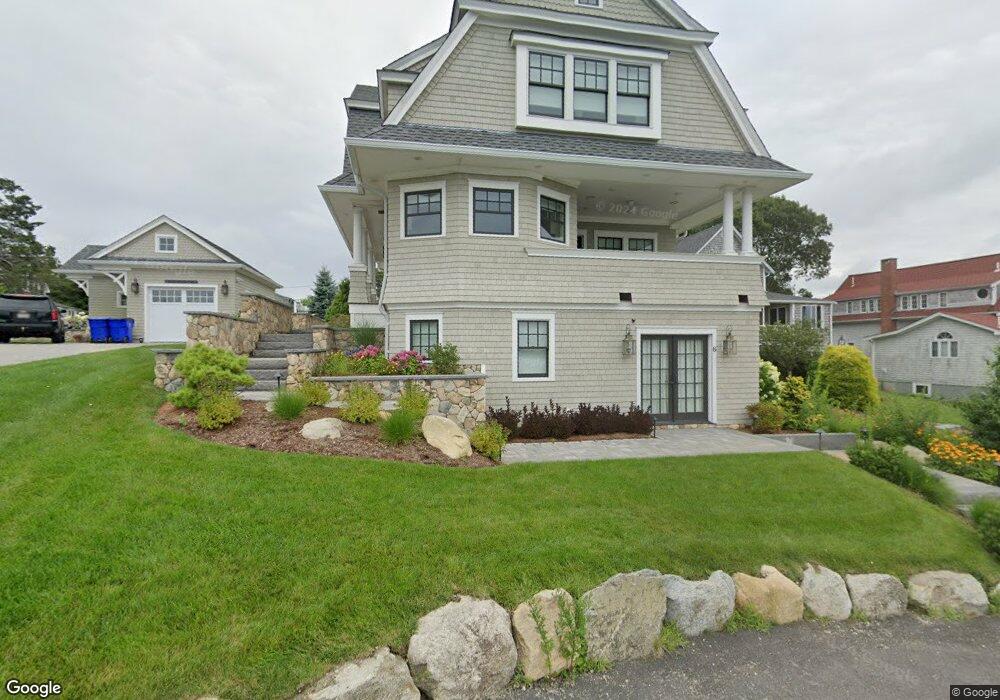
6 Cape Cod Ln Pocasset, MA 02559
Pocasset NeighborhoodEstimated Value: $1,179,000 - $1,763,634
3
Beds
2
Baths
1,501
Sq Ft
$1,007/Sq Ft
Est. Value
About This Home
This home is located at 6 Cape Cod Ln, Pocasset, MA 02559 and is currently estimated at $1,512,159, approximately $1,007 per square foot. 6 Cape Cod Ln is a home located in Barnstable County with nearby schools including Bourne High School and Cadence Academy Preschool - Bourne.
Ownership History
Date
Name
Owned For
Owner Type
Purchase Details
Closed on
Aug 30, 2016
Sold by
Finnegan John F
Bought by
Mec Rt and Carroll
Current Estimated Value
Purchase Details
Closed on
Apr 10, 2002
Sold by
Askew Henry G
Bought by
Finnegan John F
Home Financials for this Owner
Home Financials are based on the most recent Mortgage that was taken out on this home.
Original Mortgage
$388,000
Interest Rate
6.84%
Mortgage Type
Purchase Money Mortgage
Purchase Details
Closed on
Jan 2, 2002
Sold by
Celette Ft
Bought by
Askew Henry G
Home Financials for this Owner
Home Financials are based on the most recent Mortgage that was taken out on this home.
Original Mortgage
$373,600
Interest Rate
6.72%
Mortgage Type
Purchase Money Mortgage
Create a Home Valuation Report for This Property
The Home Valuation Report is an in-depth analysis detailing your home's value as well as a comparison with similar homes in the area
Home Values in the Area
Average Home Value in this Area
Purchase History
| Date | Buyer | Sale Price | Title Company |
|---|---|---|---|
| Mec Rt | $600,000 | -- | |
| Mec Rt | $600,000 | -- | |
| Finnegan John F | $485,000 | -- | |
| Finnegan John F | $485,000 | -- | |
| Askew Henry G | $467,000 | -- | |
| Askew Henry G | $467,000 | -- |
Source: Public Records
Mortgage History
| Date | Status | Borrower | Loan Amount |
|---|---|---|---|
| Previous Owner | Askew Henry G | $388,000 | |
| Previous Owner | Askew Henry G | $373,600 |
Source: Public Records
Tax History
| Year | Tax Paid | Tax Assessment Tax Assessment Total Assessment is a certain percentage of the fair market value that is determined by local assessors to be the total taxable value of land and additions on the property. | Land | Improvement |
|---|---|---|---|---|
| 2025 | $10,886 | $1,393,900 | $535,900 | $858,000 |
| 2024 | $10,709 | $1,335,300 | $510,400 | $824,900 |
| 2023 | $10,487 | $1,190,300 | $451,700 | $738,600 |
| 2022 | $10,623 | $1,052,800 | $399,700 | $653,100 |
| 2021 | $10,108 | $938,500 | $363,800 | $574,700 |
| 2020 | $5,899 | $549,300 | $360,300 | $189,000 |
| 2019 | $3,594 | $342,000 | $342,000 | $0 |
| 2018 | $4,846 | $459,800 | $325,800 | $134,000 |
| 2017 | $4,684 | $454,800 | $322,700 | $132,100 |
| 2016 | $4,423 | $435,300 | $322,700 | $112,600 |
| 2015 | $4,167 | $413,800 | $301,200 | $112,600 |
Source: Public Records
Map
Nearby Homes
Your Personal Tour Guide
Ask me questions while you tour the home.