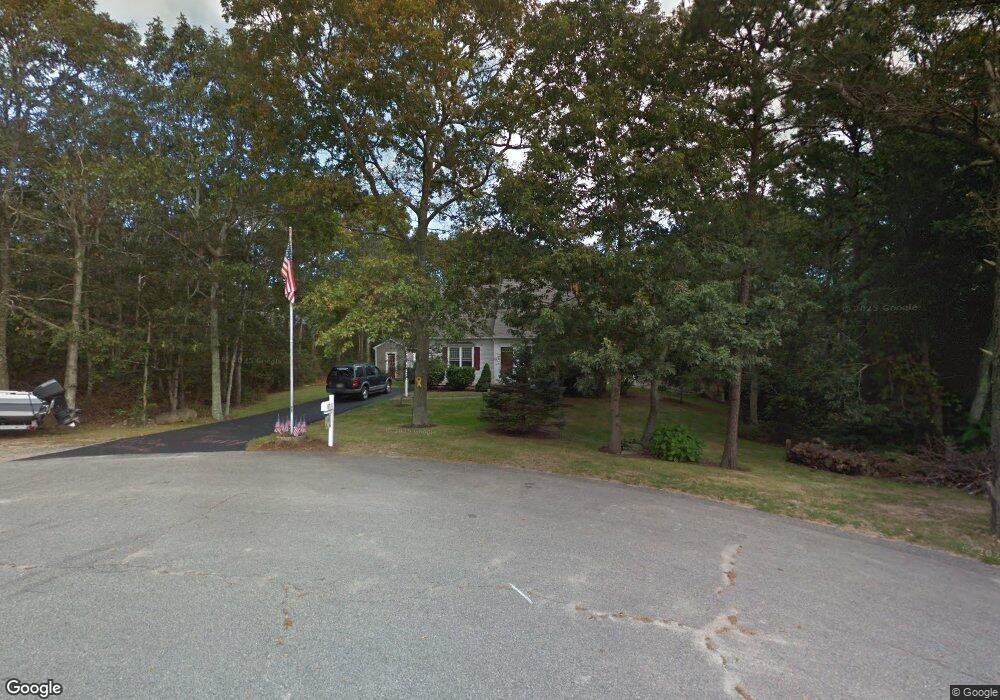
6 Capes Trail West Barnstable, MA 02668
West Barnstable NeighborhoodEstimated Value: $626,516 - $731,000
4
Beds
2
Baths
1,452
Sq Ft
$472/Sq Ft
Est. Value
About This Home
This home is located at 6 Capes Trail, West Barnstable, MA 02668 and is currently estimated at $685,129, approximately $471 per square foot. 6 Capes Trail is a home located in Barnstable County with nearby schools including West Barnstable Elementary School, Barnstable United Elementary School, and Barnstable Intermediate School.
Ownership History
Date
Name
Owned For
Owner Type
Purchase Details
Closed on
Aug 9, 1991
Sold by
Bayside Bldg Co Inc
Bought by
Provitola Daniel J and Kathleen Provitola
Current Estimated Value
Home Financials for this Owner
Home Financials are based on the most recent Mortgage that was taken out on this home.
Original Mortgage
$106,200
Interest Rate
9.58%
Mortgage Type
Purchase Money Mortgage
Create a Home Valuation Report for This Property
The Home Valuation Report is an in-depth analysis detailing your home's value as well as a comparison with similar homes in the area
Home Values in the Area
Average Home Value in this Area
Purchase History
| Date | Buyer | Sale Price | Title Company |
|---|---|---|---|
| Provitola Daniel J | $118,000 | -- |
Source: Public Records
Mortgage History
| Date | Status | Borrower | Loan Amount |
|---|---|---|---|
| Open | Provitola Daniel J | $50,000 | |
| Open | Provitola Daniel J | $155,000 | |
| Closed | Provitola Daniel J | $141,450 | |
| Closed | Provitola Daniel J | $106,200 |
Source: Public Records
Tax History Compared to Growth
Tax History
| Year | Tax Paid | Tax Assessment Tax Assessment Total Assessment is a certain percentage of the fair market value that is determined by local assessors to be the total taxable value of land and additions on the property. | Land | Improvement |
|---|---|---|---|---|
| 2025 | $5,086 | $544,500 | $177,300 | $367,200 |
| 2024 | $4,499 | $524,400 | $177,300 | $347,100 |
| 2023 | $4,298 | $471,800 | $161,300 | $310,500 |
| 2022 | $4,215 | $379,400 | $119,800 | $259,600 |
| 2021 | $4,019 | $342,900 | $119,800 | $223,100 |
| 2020 | $4,192 | $345,900 | $127,500 | $218,400 |
| 2019 | $3,969 | $323,200 | $127,500 | $195,700 |
| 2018 | $3,741 | $301,900 | $134,200 | $167,700 |
| 2017 | $3,590 | $293,300 | $134,200 | $159,100 |
| 2016 | $3,553 | $296,300 | $137,200 | $159,100 |
| 2015 | $3,376 | $282,300 | $129,600 | $152,700 |
Source: Public Records
Map
Nearby Homes