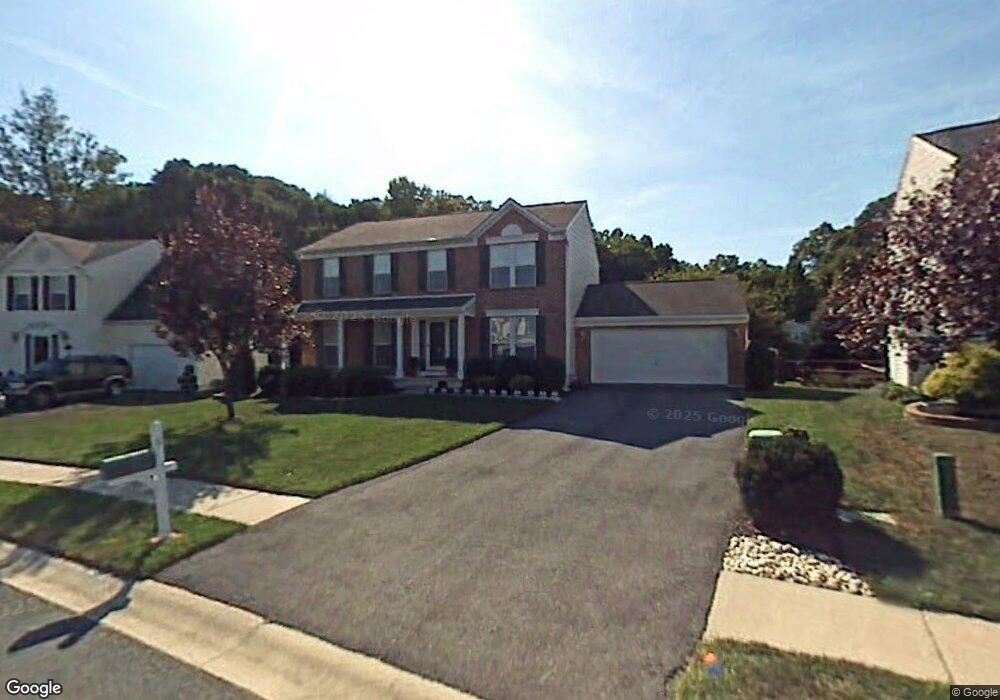
6 Castlegate Ct Newark, DE 19702
Estimated Value: $467,000 - $521,000
4
Beds
3
Baths
2,204
Sq Ft
$226/Sq Ft
Est. Value
About This Home
This home is located at 6 Castlegate Ct, Newark, DE 19702 and is currently estimated at $498,061, approximately $225 per square foot. 6 Castlegate Ct is a home located in New Castle County with nearby schools including Henry M. Brader Elementary School, Gauger-Cobbs Middle School, and Glasgow High School.
Ownership History
Date
Name
Owned For
Owner Type
Purchase Details
Closed on
Jul 9, 2002
Sold by
Cendant Mobility Financial Corp
Bought by
Gazdzinski Mark J
Current Estimated Value
Home Financials for this Owner
Home Financials are based on the most recent Mortgage that was taken out on this home.
Original Mortgage
$175,200
Outstanding Balance
$74,376
Interest Rate
6.73%
Estimated Equity
$423,685
Purchase Details
Closed on
May 22, 2002
Sold by
Brown Karen L
Bought by
Cendant Mobility Financial Corp
Home Financials for this Owner
Home Financials are based on the most recent Mortgage that was taken out on this home.
Original Mortgage
$175,200
Outstanding Balance
$74,376
Interest Rate
6.73%
Estimated Equity
$423,685
Purchase Details
Closed on
May 25, 2001
Sold by
Snyder Darrell K and Snyder Sherrita A
Bought by
Brown Karen L
Home Financials for this Owner
Home Financials are based on the most recent Mortgage that was taken out on this home.
Original Mortgage
$199,500
Interest Rate
7.09%
Create a Home Valuation Report for This Property
The Home Valuation Report is an in-depth analysis detailing your home's value as well as a comparison with similar homes in the area
Home Values in the Area
Average Home Value in this Area
Purchase History
| Date | Buyer | Sale Price | Title Company |
|---|---|---|---|
| Gazdzinski Mark J | $219,000 | -- | |
| Cendant Mobility Financial Corp | $219,000 | -- | |
| Brown Karen L | $210,000 | -- |
Source: Public Records
Mortgage History
| Date | Status | Borrower | Loan Amount |
|---|---|---|---|
| Open | Gazdzinski Mark J | $175,200 | |
| Previous Owner | Brown Karen L | $199,500 | |
| Closed | Gazdzinski Mark J | $43,800 |
Source: Public Records
Tax History
| Year | Tax Paid | Tax Assessment Tax Assessment Total Assessment is a certain percentage of the fair market value that is determined by local assessors to be the total taxable value of land and additions on the property. | Land | Improvement |
|---|---|---|---|---|
| 2024 | $3,639 | $82,800 | $12,600 | $70,200 |
| 2023 | $3,544 | $82,800 | $12,600 | $70,200 |
| 2022 | $3,519 | $82,800 | $12,600 | $70,200 |
| 2021 | $3,444 | $82,800 | $12,600 | $70,200 |
| 2020 | $3,349 | $82,800 | $12,600 | $70,200 |
| 2019 | $3,175 | $82,800 | $12,600 | $70,200 |
| 2018 | $2,903 | $82,800 | $12,600 | $70,200 |
| 2017 | $2,804 | $82,800 | $12,600 | $70,200 |
| 2016 | $2,782 | $82,800 | $12,600 | $70,200 |
| 2015 | $2,544 | $82,800 | $12,600 | $70,200 |
| 2014 | $2,546 | $82,800 | $12,600 | $70,200 |
Source: Public Records
Map
Nearby Homes
- 122 Bartley Dr
- 676 Mayfield Falls Dr
- 663 Mayfield Falls Dr
- 511 Davis Falls Dr
- 17 Oakview Dr
- 34 Photinia Dr
- 228 Jasmine Ln
- 414 S Barrington Ct
- 9 Coralberry Dr
- 209 W Edgewater Way
- 142 Couples Dr
- 10 Hatteras Ct
- 116 Autumn Horseshoe Bend
- 6 Shade Tree Ln
- 111 N Tartan Dr
- 335 E Village Rd
- 178 Torrey Dr
- 104 Waters Edge Dr Unit 104
- 3017 Frenchtown Rd
- 1604 Waters Edge Dr Unit 1604
- 4 Castlegate Ct
- 8 Castlegate Ct
- 207 Barnwell Ln
- 2 Castlegate Ct
- 7 Castlegate Ct
- 3 Castlegate Ct
- 213 Barnwell Ln
- 9 Castlegate Ct
- 12 Castlegate Ct
- 215 Barnwell Ln
- 11 Castlegate Ct
- 210 Barnwell Ln
- 208 Barnwell Ln
- 212 Barnwell Ln
- 13 Castlegate Ct
- 206 Barnwell Ln
- 217 Barnwell Ln
- 214 Barnwell Ln
- 203 Barnwell Ln
- 216 Barnwell Ln
Your Personal Tour Guide
Ask me questions while you tour the home.