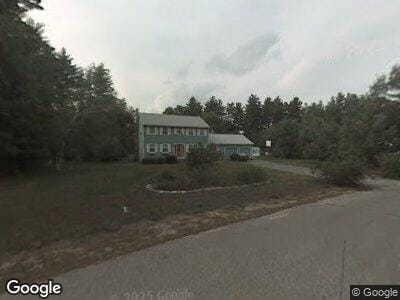
6 Circle Dr MerriMacK, NH 03054
Estimated Value: $582,000 - $653,000
4
Beds
3
Baths
2,686
Sq Ft
$231/Sq Ft
Est. Value
About This Home
This home is located at 6 Circle Dr, MerriMacK, NH 03054 and is currently estimated at $619,188, approximately $230 per square foot. 6 Circle Dr is a home located in Hillsborough County with nearby schools including Reeds Ferry School, James Mastricola Upper Elementary School, and Merrimack Middle School.
Ownership History
Date
Name
Owned For
Owner Type
Purchase Details
Closed on
Feb 8, 2021
Sold by
Gardenour Jeffrey M and Gardenour Wendy
Bought by
Gardenour Wendy
Current Estimated Value
Purchase Details
Closed on
Jul 13, 2001
Sold by
Kim Uno
Bought by
Curran William H and Curran Maria Dean
Home Financials for this Owner
Home Financials are based on the most recent Mortgage that was taken out on this home.
Original Mortgage
$226,800
Interest Rate
7.2%
Create a Home Valuation Report for This Property
The Home Valuation Report is an in-depth analysis detailing your home's value as well as a comparison with similar homes in the area
Home Values in the Area
Average Home Value in this Area
Purchase History
| Date | Buyer | Sale Price | Title Company |
|---|---|---|---|
| Gardenour Wendy | -- | None Available | |
| Curran William H | $283,600 | -- |
Source: Public Records
Mortgage History
| Date | Status | Borrower | Loan Amount |
|---|---|---|---|
| Open | Gardenour Wendy | $55,000 | |
| Open | Gardenour Wendy | $331,200 | |
| Previous Owner | Curran William H | $226,800 |
Source: Public Records
Tax History Compared to Growth
Tax History
| Year | Tax Paid | Tax Assessment Tax Assessment Total Assessment is a certain percentage of the fair market value that is determined by local assessors to be the total taxable value of land and additions on the property. | Land | Improvement |
|---|---|---|---|---|
| 2024 | $8,766 | $423,700 | $220,400 | $203,300 |
| 2023 | $8,241 | $423,700 | $220,400 | $203,300 |
| 2022 | $7,364 | $423,700 | $220,400 | $203,300 |
| 2021 | $7,275 | $423,700 | $220,400 | $203,300 |
| 2020 | $7,394 | $307,300 | $154,400 | $152,900 |
| 2019 | $7,415 | $307,300 | $154,400 | $152,900 |
| 2018 | $7,412 | $307,300 | $154,400 | $152,900 |
| 2017 | $7,182 | $307,300 | $154,400 | $152,900 |
| 2016 | $6,869 | $301,400 | $154,400 | $147,000 |
| 2015 | $7,038 | $284,700 | $143,400 | $141,300 |
| 2014 | $6,858 | $284,700 | $143,400 | $141,300 |
| 2013 | $6,807 | $284,700 | $143,400 | $141,300 |
Source: Public Records
Map
Nearby Homes