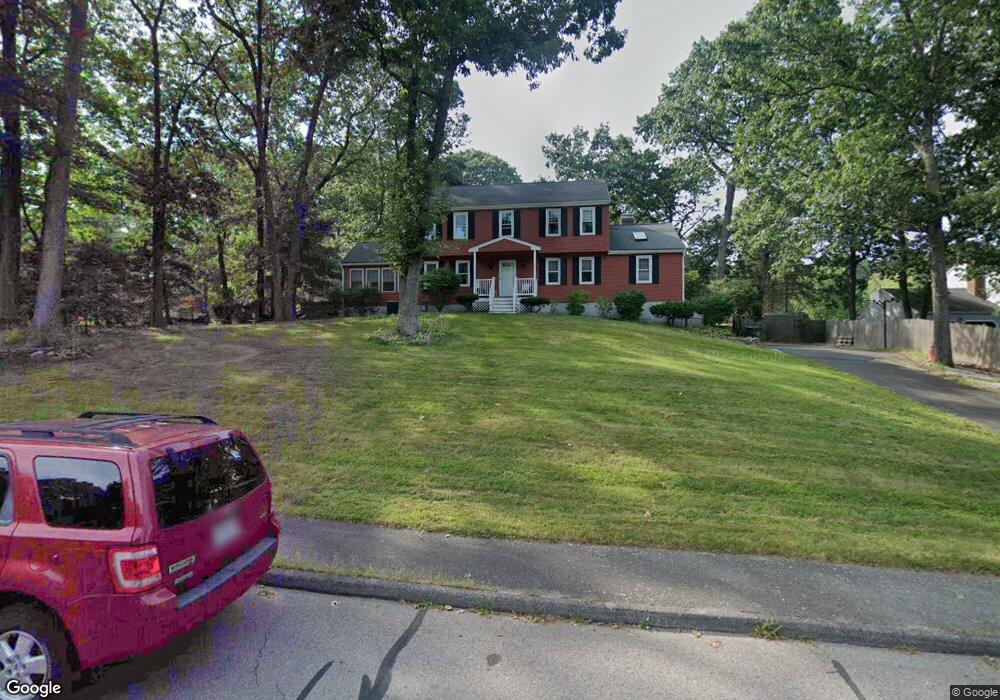
6 Cliff Rd Bellingham, MA 02019
Estimated Value: $617,314 - $772,000
3
Beds
3
Baths
2,136
Sq Ft
$317/Sq Ft
Est. Value
About This Home
This home is located at 6 Cliff Rd, Bellingham, MA 02019 and is currently estimated at $676,329, approximately $316 per square foot. 6 Cliff Rd is a home located in Norfolk County with nearby schools including Stall Brook Elementary School, Bellingham High School, and Bethany Christian Academy.
Ownership History
Date
Name
Owned For
Owner Type
Purchase Details
Closed on
Oct 16, 2012
Sold by
Bakas Gus
Bought by
Bakas Gus and Bakas Therese M
Current Estimated Value
Home Financials for this Owner
Home Financials are based on the most recent Mortgage that was taken out on this home.
Original Mortgage
$236,361
Outstanding Balance
$103,569
Interest Rate
3.59%
Mortgage Type
New Conventional
Estimated Equity
$572,760
Purchase Details
Closed on
Jun 18, 2012
Sold by
Bakas Gus
Bought by
Bakas Gus and Bakas Therese M
Create a Home Valuation Report for This Property
The Home Valuation Report is an in-depth analysis detailing your home's value as well as a comparison with similar homes in the area
Home Values in the Area
Average Home Value in this Area
Purchase History
| Date | Buyer | Sale Price | Title Company |
|---|---|---|---|
| Bakas Gus | -- | -- | |
| Bakas Gus | -- | -- |
Source: Public Records
Mortgage History
| Date | Status | Borrower | Loan Amount |
|---|---|---|---|
| Open | Bakas Gus | $236,361 |
Source: Public Records
Tax History
| Year | Tax Paid | Tax Assessment Tax Assessment Total Assessment is a certain percentage of the fair market value that is determined by local assessors to be the total taxable value of land and additions on the property. | Land | Improvement |
|---|---|---|---|---|
| 2025 | $6,988 | $556,400 | $176,200 | $380,200 |
| 2024 | $6,670 | $518,700 | $160,900 | $357,800 |
| 2023 | $6,428 | $492,600 | $153,200 | $339,400 |
| 2022 | $6,337 | $450,100 | $130,600 | $319,500 |
| 2021 | $6,123 | $424,900 | $130,600 | $294,300 |
| 2020 | $5,779 | $406,400 | $130,600 | $275,800 |
| 2019 | $5,656 | $398,000 | $130,600 | $267,400 |
| 2018 | $5,356 | $371,700 | $127,100 | $244,600 |
| 2017 | $5,197 | $362,400 | $127,100 | $235,300 |
| 2016 | $5,102 | $357,000 | $135,800 | $221,200 |
| 2015 | $4,893 | $343,400 | $130,600 | $212,800 |
| 2014 | $4,915 | $335,300 | $128,000 | $207,300 |
Source: Public Records
Map
Nearby Homes
- 95 Lisa Ann Dr
- 7 Palmetto Dr Unit 7
- 48 Donna Rd
- 23 Bellwood Cir Unit 23
- 60 Wethersfield Rd
- 67 Jeannine Rd
- 31 Bellwood Cir Unit 31B
- 123-125 Mendon St
- 1 Evergreen Dr Unit 1
- 0 Hixon St Unit 73477486
- 7 Debra Ln Unit 1
- 67 Blackstone St
- 3003 Maple Brook Rd Unit 3003
- 6 Barrows Rd
- 125 Blackstone St
- 1501 Old Bridge Ln Unit 1501
- 640 Maple Brook Rd
- 0 Hartford Ave
- 214 Conlyn Ave
- 17 Pine St
Your Personal Tour Guide
Ask me questions while you tour the home.