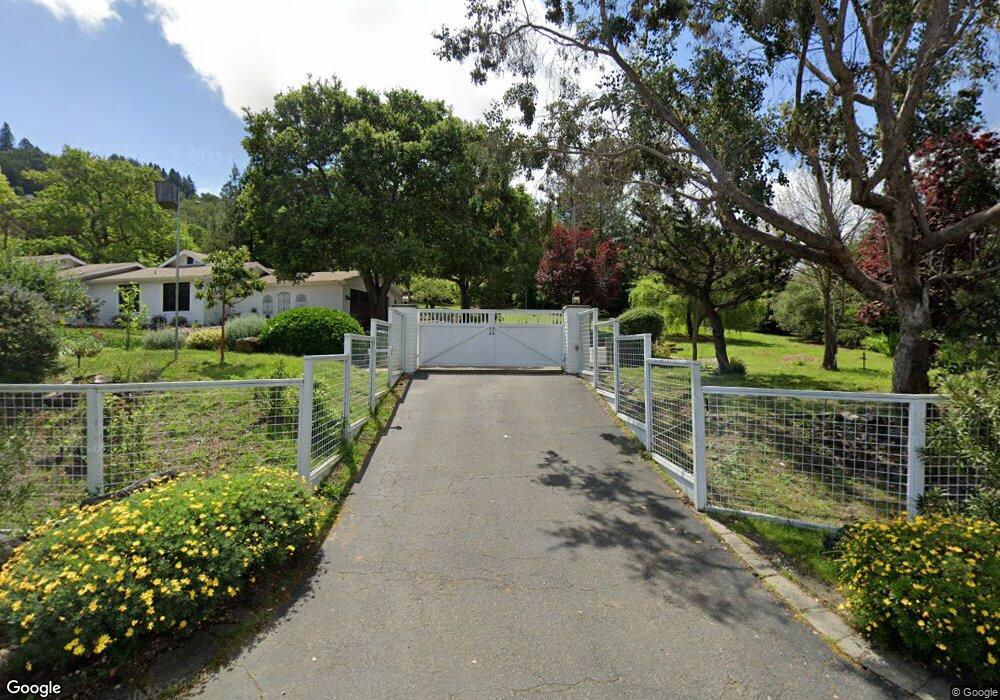
6 Debes Ranch Rd San Rafael, CA 94903
Los Ranchitos NeighborhoodEstimated Value: $2,139,000 - $3,050,000
4
Beds
4
Baths
3,225
Sq Ft
$772/Sq Ft
Est. Value
About This Home
This home is located at 6 Debes Ranch Rd, San Rafael, CA 94903 and is currently estimated at $2,490,545, approximately $772 per square foot. 6 Debes Ranch Rd is a home located in Marin County with nearby schools including Vallecito Elementary School, Miller Creek Middle School, and Terra Linda High School.
Ownership History
Date
Name
Owned For
Owner Type
Purchase Details
Closed on
Jun 27, 2016
Sold by
Fahy Will J and Fahy Patricia A
Bought by
Arora Tarun and Westhoff Michele
Current Estimated Value
Home Financials for this Owner
Home Financials are based on the most recent Mortgage that was taken out on this home.
Original Mortgage
$1,330,000
Outstanding Balance
$1,061,741
Interest Rate
3.58%
Mortgage Type
New Conventional
Estimated Equity
$1,428,804
Purchase Details
Closed on
May 31, 2011
Sold by
Debes Nicole and Riede Richard S
Bought by
Fahy Will J and Fahy Patricia A
Home Financials for this Owner
Home Financials are based on the most recent Mortgage that was taken out on this home.
Original Mortgage
$552,500
Interest Rate
3.62%
Mortgage Type
New Conventional
Purchase Details
Closed on
May 18, 2010
Sold by
Debes Nicole and Riede Richard S
Bought by
Debes Nicole
Create a Home Valuation Report for This Property
The Home Valuation Report is an in-depth analysis detailing your home's value as well as a comparison with similar homes in the area
Home Values in the Area
Average Home Value in this Area
Purchase History
| Date | Buyer | Sale Price | Title Company |
|---|---|---|---|
| Arora Tarun | $1,662,500 | Old Republic Title Co | |
| Fahy Will J | $850,000 | Old Republic Title Company | |
| Debes Nicole | -- | Old Republic Title Company | |
| Debes Nicole | -- | None Available |
Source: Public Records
Mortgage History
| Date | Status | Borrower | Loan Amount |
|---|---|---|---|
| Open | Arora Tarun | $1,330,000 | |
| Previous Owner | Fahy Will J | $552,500 |
Source: Public Records
Tax History Compared to Growth
Tax History
| Year | Tax Paid | Tax Assessment Tax Assessment Total Assessment is a certain percentage of the fair market value that is determined by local assessors to be the total taxable value of land and additions on the property. | Land | Improvement |
|---|---|---|---|---|
| 2025 | $28,373 | $2,300,891 | $1,078,414 | $1,222,477 |
| 2024 | $28,373 | $2,255,779 | $1,057,270 | $1,198,509 |
| 2023 | $28,456 | $2,211,558 | $1,036,544 | $1,175,014 |
| 2022 | $27,360 | $2,168,196 | $1,016,220 | $1,151,976 |
| 2021 | $26,126 | $2,125,686 | $996,296 | $1,129,390 |
| 2020 | $26,229 | $2,103,899 | $986,084 | $1,117,815 |
| 2019 | $24,694 | $2,002,653 | $966,753 | $1,035,900 |
| 2018 | $23,102 | $1,848,104 | $947,804 | $900,300 |
| 2017 | $20,532 | $1,694,220 | $929,220 | $765,000 |
| 2016 | $11,799 | $919,912 | $649,350 | $270,562 |
| 2015 | $11,502 | $906,100 | $639,600 | $266,500 |
| 2014 | $10,756 | $888,352 | $627,072 | $261,280 |
Source: Public Records
Map
Nearby Homes
- 5 Sequoia Rd
- 109 Boxwood Dr
- 221 Spindle Ct
- 48 Ranch Rd
- 29 Red Rock Way
- 21 Red Rock Way
- 65 Circle Rd
- 19 Tarrant Ct
- 119 Oakmont Ave
- 0 Chula Vista Dr Unit 325048499
- 0 Chula Vista Dr Unit 325048500
- 0 Chula Vista Dr Unit 325048501
- 0 Chula Vista Dr Unit 325048502
- 0 Chula Vista Dr Unit 325048503
- 0 Chula Vista Dr Unit 325048504
- 0 Chula Vista Dr Unit 325048505
- 1893 Lincoln Ave
- 57 Fair Dr
- 0 Fair Dr Unit 325072555
- 77 Fair Dr