Estimated Value: $320,277 - $387,000
2
Beds
2
Baths
1,560
Sq Ft
$228/Sq Ft
Est. Value
About This Home
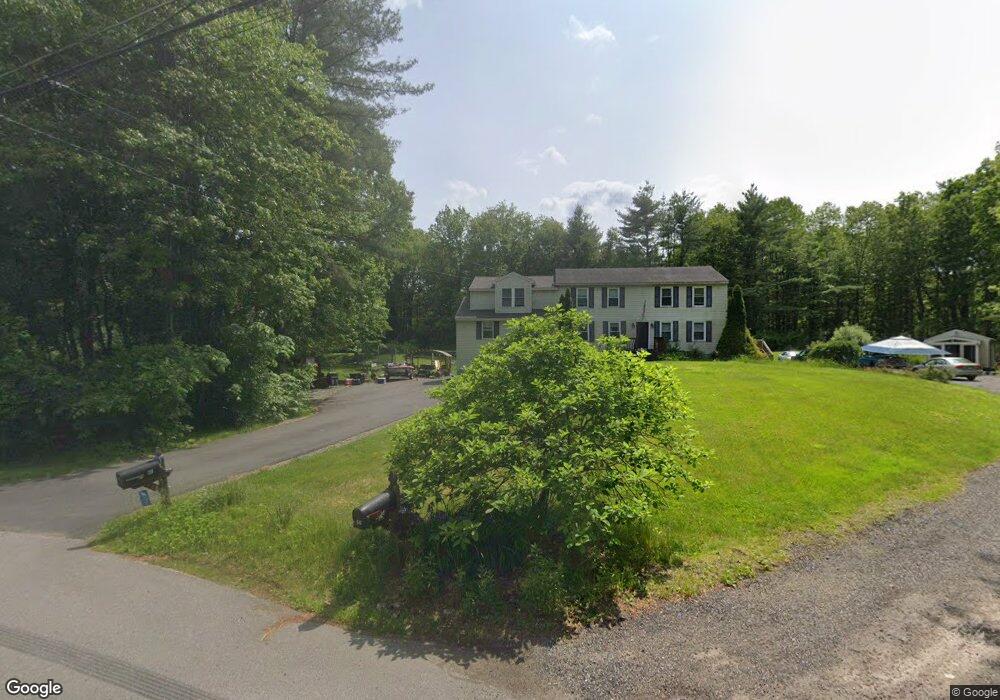
This home is located at 6 Desforge Ln Unit R, Derry, NH 03038 and is currently estimated at $356,069, approximately $228 per square foot. 6 Desforge Ln Unit R is a home located in Rockingham County with nearby schools including East Derry Memorial Elementary School, Gilbert H. Hood Middle School, and Pinkerton Academy.
Ownership History
Date
Name
Owned For
Owner Type
Purchase Details
Closed on
Aug 10, 2020
Sold by
Sargent Michael H and Connors Deanna A
Bought by
Quirke William M
Current Estimated Value
Home Financials for this Owner
Home Financials are based on the most recent Mortgage that was taken out on this home.
Original Mortgage
$231,520
Outstanding Balance
$203,050
Interest Rate
3%
Mortgage Type
Purchase Money Mortgage
Estimated Equity
$153,019
Purchase Details
Closed on
Jan 10, 2019
Sold by
Sargent Michael G
Bought by
Sargent Michael G and Connors Deanna A
Purchase Details
Closed on
Dec 31, 2007
Sold by
Est Pelczarski Tracy L and Sullivan Lisa D
Bought by
Sargent Michael G
Home Financials for this Owner
Home Financials are based on the most recent Mortgage that was taken out on this home.
Original Mortgage
$165,667
Interest Rate
6.27%
Create a Home Valuation Report for This Property
The Home Valuation Report is an in-depth analysis detailing your home's value as well as a comparison with similar homes in the area
Home Values in the Area
Average Home Value in this Area
Purchase History
| Date | Buyer | Sale Price | Title Company |
|---|---|---|---|
| Quirke William M | $238,733 | None Available | |
| Sargent Michael G | -- | -- | |
| Sargent Michael G | $165,000 | -- |
Source: Public Records
Mortgage History
| Date | Status | Borrower | Loan Amount |
|---|---|---|---|
| Open | Quirke William M | $231,520 | |
| Previous Owner | Sargent Michael G | $8,025 | |
| Previous Owner | Sargent Michael G | $21,800 | |
| Previous Owner | Sargent Michael G | $165,667 |
Source: Public Records
Tax History
| Year | Tax Paid | Tax Assessment Tax Assessment Total Assessment is a certain percentage of the fair market value that is determined by local assessors to be the total taxable value of land and additions on the property. | Land | Improvement |
|---|---|---|---|---|
| 2025 | $5,053 | $266,100 | $0 | $266,100 |
| 2024 | $4,973 | $266,100 | $0 | $266,100 |
| 2023 | $4,645 | $224,600 | $0 | $224,600 |
| 2022 | $4,276 | $224,600 | $0 | $224,600 |
| 2021 | $4,014 | $162,100 | $0 | $162,100 |
| 2020 | $3,946 | $162,100 | $0 | $162,100 |
| 2019 | $4,861 | $186,100 | $100,700 | $85,400 |
| 2018 | $4,844 | $186,100 | $100,700 | $85,400 |
| 2017 | $5,033 | $174,400 | $93,700 | $80,700 |
| 2016 | $4,719 | $174,400 | $93,700 | $80,700 |
| 2015 | $3,376 | $115,500 | $47,100 | $68,400 |
| 2014 | $3,398 | $115,500 | $47,100 | $68,400 |
| 2013 | $3,486 | $110,700 | $42,100 | $68,600 |
Source: Public Records
Map
Nearby Homes
- 211 Hampstead Rd
- 3 Pine Bluff
- 47 Drew Woods Dr
- 12 Halls Village Rd
- 4 Sheldon Rd
- 15 Bonnie Ln Unit R
- 7 Cameron Ct Unit 7
- 18 Lorri Rd
- 1 Cameron Ct Unit 1
- 5 Stone Fence Dr
- 0 Jack Rd
- 18 N Shore Rd
- 128 N Shore Rd
- 50 Page Ln
- 1 Grandview Ave
- 4C Pine Isle Dr Unit B
- 32 Chester Rd
- 35 Steele Rd
- 76 Tsienneto Rd
- 343 Island Pond Rd
- 6 Desforge Ln Unit L
- 4 Desforge Ln
- 7 Desforge Ln Unit L
- 200 Hampstead Rd
- 5R Desforge Ln Unit 5
- 5 Desforge Ln Unit R
- 5 Desforge Ln Unit L
- 5 Desforge Ln Unit 5
- 5 Desforge Ln Unit 5L
- 5 Desforge Ln Unit Left
- 3 Desforge Ln
- 202 Hampstead Rd
- 204 Hampstead Rd
- 196 Hampstead Rd
- 2 Maurice Rd Unit R
- 2 Maurice Rd Unit L
- 2 Maurice Rd Unit 2L
- 2 Maurice Rd
- 4 Maurice Rd
- 1A Maurice Rd Unit 1A
Your Personal Tour Guide
Ask me questions while you tour the home.