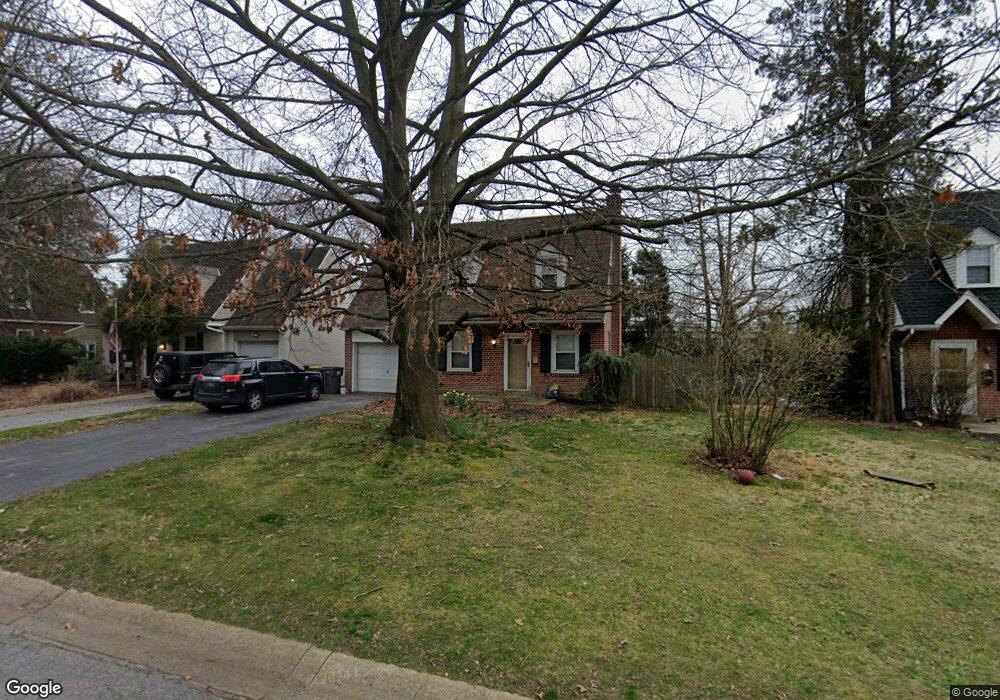
6 E Salisbury Dr Wilmington, DE 19809
Estimated Value: $282,000 - $325,000
3
Beds
1
Bath
1,000
Sq Ft
$308/Sq Ft
Est. Value
About This Home
This home is located at 6 E Salisbury Dr, Wilmington, DE 19809 and is currently estimated at $307,968, approximately $307 per square foot. 6 E Salisbury Dr is a home located in New Castle County with nearby schools including Mount Pleasant Elementary School, Pierre S. Dupont Middle School, and Mount Pleasant High School.
Ownership History
Date
Name
Owned For
Owner Type
Purchase Details
Closed on
May 12, 2010
Sold by
Neide William E and Neide Brandy L
Bought by
Taylor Matthew R
Current Estimated Value
Home Financials for this Owner
Home Financials are based on the most recent Mortgage that was taken out on this home.
Original Mortgage
$192,498
Outstanding Balance
$129,402
Interest Rate
5.11%
Mortgage Type
FHA
Estimated Equity
$178,566
Purchase Details
Closed on
Aug 19, 2004
Sold by
Neide William E and Neide Brandy B
Bought by
Neide William E and Neide Brandy B
Purchase Details
Closed on
Mar 25, 2004
Sold by
Moran Shawn and Bradshaw Moran Kelly
Bought by
Neide William E and Baugher Brandy L
Home Financials for this Owner
Home Financials are based on the most recent Mortgage that was taken out on this home.
Original Mortgage
$152,000
Interest Rate
5.56%
Mortgage Type
Purchase Money Mortgage
Purchase Details
Closed on
Dec 3, 2003
Sold by
Kwasizur Kathleen and Jackson Margaret
Bought by
Moran Shawn and Bradshaw Moran Kelly
Purchase Details
Closed on
Jan 31, 2002
Sold by
Cianfrani Alisa M
Bought by
Hill Daniel J and Hill Jacqueline M
Home Financials for this Owner
Home Financials are based on the most recent Mortgage that was taken out on this home.
Original Mortgage
$121,150
Interest Rate
7.15%
Create a Home Valuation Report for This Property
The Home Valuation Report is an in-depth analysis detailing your home's value as well as a comparison with similar homes in the area
Home Values in the Area
Average Home Value in this Area
Purchase History
| Date | Buyer | Sale Price | Title Company |
|---|---|---|---|
| Taylor Matthew R | $196,050 | None Available | |
| Neide William E | -- | -- | |
| Neide William E | $160,000 | -- | |
| Moran Shawn | $127,266 | -- | |
| Hill Daniel J | $124,900 | -- |
Source: Public Records
Mortgage History
| Date | Status | Borrower | Loan Amount |
|---|---|---|---|
| Open | Taylor Matthew R | $192,498 | |
| Previous Owner | Neide William E | $152,000 | |
| Previous Owner | Hill Daniel J | $121,150 |
Source: Public Records
Tax History
| Year | Tax Paid | Tax Assessment Tax Assessment Total Assessment is a certain percentage of the fair market value that is determined by local assessors to be the total taxable value of land and additions on the property. | Land | Improvement |
|---|---|---|---|---|
| 2024 | $2,009 | $52,800 | $8,800 | $44,000 |
| 2023 | $1,836 | $52,800 | $8,800 | $44,000 |
| 2022 | $1,868 | $52,800 | $8,800 | $44,000 |
| 2021 | $1,868 | $52,800 | $8,800 | $44,000 |
| 2020 | $1,868 | $52,800 | $8,800 | $44,000 |
| 2019 | $2,084 | $52,800 | $8,800 | $44,000 |
| 2018 | $1,785 | $52,800 | $8,800 | $44,000 |
| 2017 | $1,758 | $52,800 | $8,800 | $44,000 |
| 2016 | $1,756 | $52,800 | $8,800 | $44,000 |
| 2015 | $1,616 | $52,800 | $8,800 | $44,000 |
| 2014 | $1,614 | $52,800 | $8,800 | $44,000 |
Source: Public Records
Map
Nearby Homes
- 3 Paynter Dr
- 2 Polk Dr
- 37 S Cannon Dr
- 12 N Rodney Dr
- 21 N Rodney Dr
- 37 W Salisbury Dr
- 26 S Pennewell Dr
- 47 N Pennewell Dr
- 302 River Rd Unit D8
- 128 Paladin Dr
- 52 Paladin Dr Unit 52
- 10 Brandywine Blvd
- 4103 Eastview Ln
- 59 Paladin Dr
- 57 Paladin Dr
- 32 Riverside Dr
- 5213 Le Parc Dr Unit 7
- 910 Marion Ave
- 5 Hillcrest Ave
- 208 Philadelphia Pike
- 8 E Salisbury Dr
- 4 E Salisbury Dr
- 10 E Salisbury Dr
- 2 E Salisbury Dr
- 12 E Salisbury Dr
- 7 E Salisbury Dr
- 5 E Salisbury Dr
- 9 E Salisbury Dr
- 3 E Salisbury Dr
- 11 E Salisbury Dr
- 14 E Salisbury Dr
- 1 E Salisbury Dr
- 2 N Stuyvesant Dr
- 16 E Salisbury Dr
- 13 E Salisbury Dr
- 2 W Salisbury Dr
- 1 S Stuyvesant Dr
- 4 N Stuyvesant Dr
- 1 W Salisbury Dr
- 15 E Salisbury Dr
Your Personal Tour Guide
Ask me questions while you tour the home.