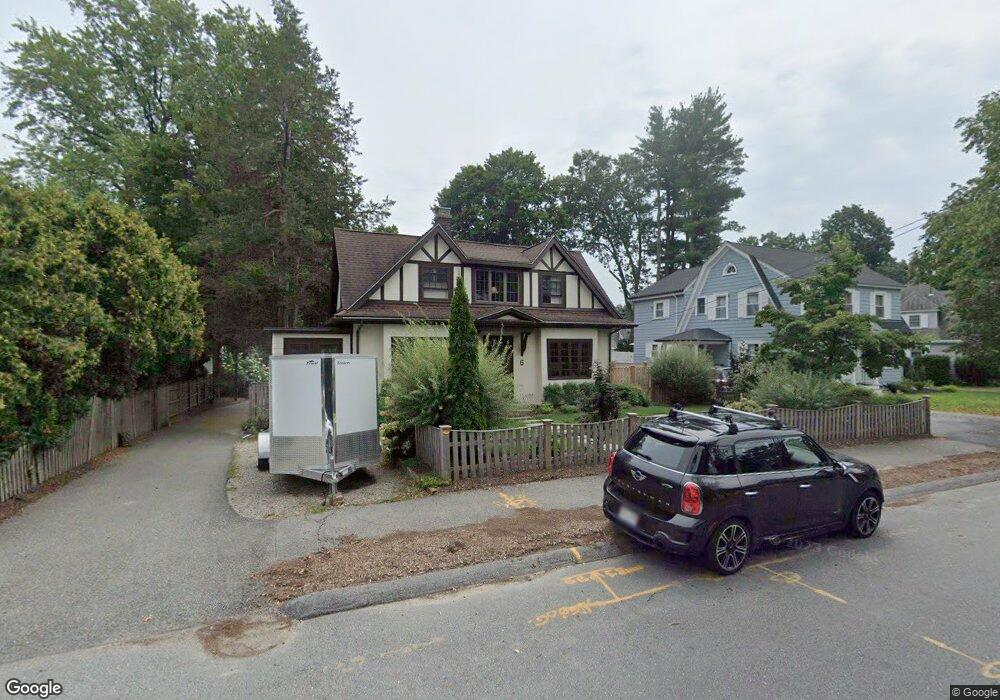
6 Fells Rd Wellesley, MA 02482
Estimated Value: $1,144,000 - $1,710,000
3
Beds
3
Baths
2,114
Sq Ft
$659/Sq Ft
Est. Value
About This Home
This home is located at 6 Fells Rd, Wellesley, MA 02482 and is currently estimated at $1,392,566, approximately $658 per square foot. 6 Fells Rd is a home located in Norfolk County with nearby schools including John D. Hardy Elementary School, Wellesley Middle School, and Wellesley Sr High School.
Ownership History
Date
Name
Owned For
Owner Type
Purchase Details
Closed on
Oct 31, 1996
Sold by
Montague Juliette H and Montague James
Bought by
Delollis Constantino M and Delollis Heidi M
Current Estimated Value
Purchase Details
Closed on
Apr 1, 1993
Sold by
Fcm 1992 Rt
Bought by
Montague Juliette H and Montague James
Create a Home Valuation Report for This Property
The Home Valuation Report is an in-depth analysis detailing your home's value as well as a comparison with similar homes in the area
Purchase History
| Date | Buyer | Sale Price | Title Company |
|---|---|---|---|
| Delollis Constantino M | $278,700 | -- | |
| Montague Juliette H | $237,000 | -- |
Source: Public Records
Mortgage History
| Date | Status | Borrower | Loan Amount |
|---|---|---|---|
| Open | Montague Juliette H | $580,000 | |
| Closed | Montague Juliette H | $50,000 | |
| Closed | Montague Juliette H | $160,000 |
Source: Public Records
Tax History
| Year | Tax Paid | Tax Assessment Tax Assessment Total Assessment is a certain percentage of the fair market value that is determined by local assessors to be the total taxable value of land and additions on the property. | Land | Improvement |
|---|---|---|---|---|
| 2025 | $12,829 | $1,248,000 | $1,000,000 | $248,000 |
| 2024 | $11,961 | $1,149,000 | $909,000 | $240,000 |
| 2023 | $11,565 | $1,010,000 | $806,000 | $204,000 |
| 2022 | $11,493 | $984,000 | $692,000 | $292,000 |
| 2021 | $11,210 | $954,000 | $662,000 | $292,000 |
| 2020 | $11,028 | $954,000 | $662,000 | $292,000 |
| 2019 | $10,691 | $924,000 | $632,000 | $292,000 |
| 2018 | $10,146 | $849,000 | $623,000 | $226,000 |
| 2017 | $9,550 | $810,000 | $623,000 | $187,000 |
| 2016 | $9,381 | $793,000 | $612,000 | $181,000 |
| 2015 | $8,843 | $765,000 | $583,000 | $182,000 |
Source: Public Records
Map
Nearby Homes
- 5 Wilde Rd
- 23 Pilgrim Rd
- 25 Mansfield Rd
- 29 Pinewood Rd
- 33 Avon Rd
- 38 Parker Rd
- 4 Shore Rd
- 148 Weston Rd Unit 208
- 148 Weston Rd Unit 207
- 31 College Rd
- 63 Oak St Unit B
- 19 Northgate Rd
- 16 Stearns Rd Unit 101
- 16 Stearns Rd Unit 106
- 16 Stearns Rd Unit 103
- 16 Stearns Rd Unit 301
- 16 Stearns Rd Unit 304
- 16 Stearns Rd Unit 104
- 8 Oakdale Ave
- 200 Pond Rd
Your Personal Tour Guide
Ask me questions while you tour the home.