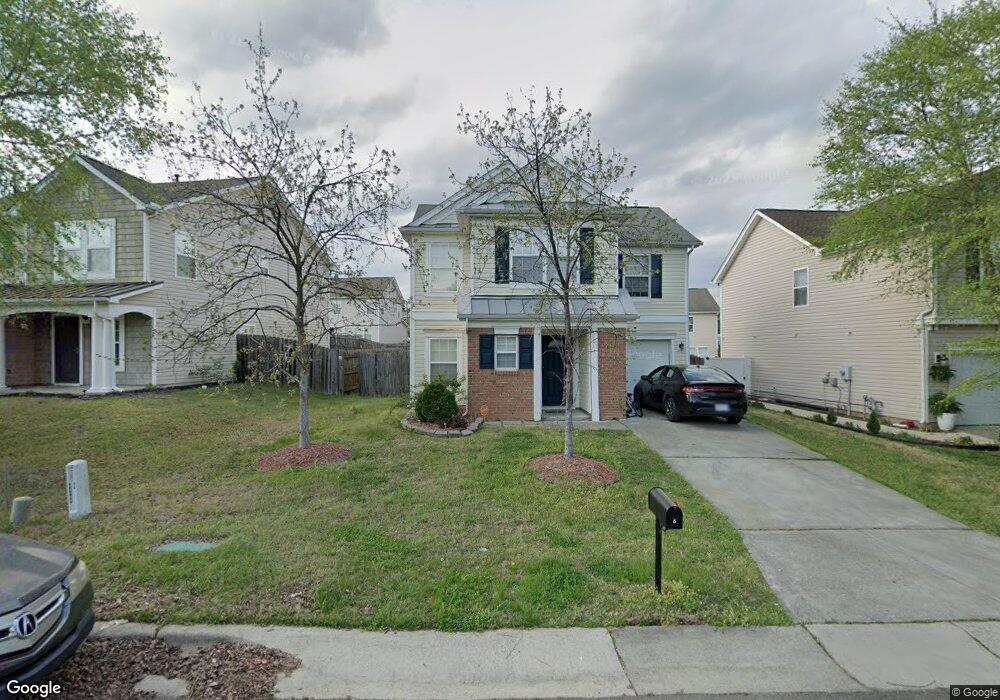
6 Fielding Ct Durham, NC 27703
Eastern Durham NeighborhoodEstimated Value: $329,502 - $371,000
3
Beds
3
Baths
1,815
Sq Ft
$189/Sq Ft
Est. Value
About This Home
This home is located at 6 Fielding Ct, Durham, NC 27703 and is currently estimated at $343,876, approximately $189 per square foot. 6 Fielding Ct is a home located in Durham County with nearby schools including Glenn Elementary, John W Neal Middle School, and Southern School of Energy & Sustainability.
Ownership History
Date
Name
Owned For
Owner Type
Purchase Details
Closed on
Mar 8, 2021
Sold by
Yang Cheenou and Lee Mai
Bought by
Tny Properties Llc
Current Estimated Value
Purchase Details
Closed on
Jun 27, 2013
Sold by
Hurtado Alfredo and Hurtado Diana
Bought by
Yang Cheenou and Lee Mai
Home Financials for this Owner
Home Financials are based on the most recent Mortgage that was taken out on this home.
Original Mortgage
$147,000
Interest Rate
3.53%
Mortgage Type
New Conventional
Purchase Details
Closed on
Oct 21, 2005
Sold by
Kb Home Raleigh Durham Llc
Bought by
Hurtado Alfredo and Hurtado Diana
Home Financials for this Owner
Home Financials are based on the most recent Mortgage that was taken out on this home.
Original Mortgage
$150,110
Interest Rate
5.71%
Mortgage Type
VA
Create a Home Valuation Report for This Property
The Home Valuation Report is an in-depth analysis detailing your home's value as well as a comparison with similar homes in the area
Home Values in the Area
Average Home Value in this Area
Purchase History
| Date | Buyer | Sale Price | Title Company |
|---|---|---|---|
| Tny Properties Llc | -- | None Available | |
| Yang Cheenou | $147,000 | None Available | |
| Hurtado Alfredo | $150,500 | -- |
Source: Public Records
Mortgage History
| Date | Status | Borrower | Loan Amount |
|---|---|---|---|
| Previous Owner | Yang Cheenou | $147,000 | |
| Previous Owner | Hurtado Alfredo | $150,110 |
Source: Public Records
Tax History
| Year | Tax Paid | Tax Assessment Tax Assessment Total Assessment is a certain percentage of the fair market value that is determined by local assessors to be the total taxable value of land and additions on the property. | Land | Improvement |
|---|---|---|---|---|
| 2025 | $3,438 | $346,784 | $70,000 | $276,784 |
| 2024 | $2,256 | $172,206 | $33,630 | $138,576 |
| 2023 | $2,256 | $172,206 | $33,630 | $138,576 |
| 2022 | $2,204 | $172,206 | $33,630 | $138,576 |
| 2021 | $2,194 | $172,206 | $33,630 | $138,576 |
| 2020 | $2,142 | $172,206 | $33,630 | $138,576 |
| 2019 | $2,142 | $172,206 | $33,630 | $138,576 |
| 2018 | $1,966 | $144,902 | $28,025 | $116,877 |
| 2017 | $1,951 | $144,902 | $28,025 | $116,877 |
| 2016 | $1,885 | $144,902 | $28,025 | $116,877 |
| 2015 | $2,172 | $156,876 | $28,211 | $128,665 |
| 2014 | $2,172 | $156,876 | $28,211 | $128,665 |
Source: Public Records
Map
Nearby Homes
- 409 Magna Dr
- 509 Pebblestone Dr
- 3721 Brightwood Ln
- 608 Clearfield Dr
- 516 Cove Hollow Dr
- 1742 Fletchers Chapel Rd
- 1828 Fletchers Chapel Rd
- 110 Rosebud Ln
- 1201 Opal Ln
- 4009 Fiesta Rd
- 1213 Opal Ln
- 7 Duxford Ct
- 1515 Hatteras Rd
- 914 Flanders Dr
- 1513 Hatteras Rd
- 1511 Hatteras Rd
- 1509 Hatteras Rd
- 1050 Gentle Reed Dr
- 1507 Hatteras Rd
- 2145 Topsail Rd
Your Personal Tour Guide
Ask me questions while you tour the home.