A
Seller's Agent in 2012
Alyssa Halisky
Wallace & Co. Sotheby's
Estimated Value: $1,307,527 - $1,468,000
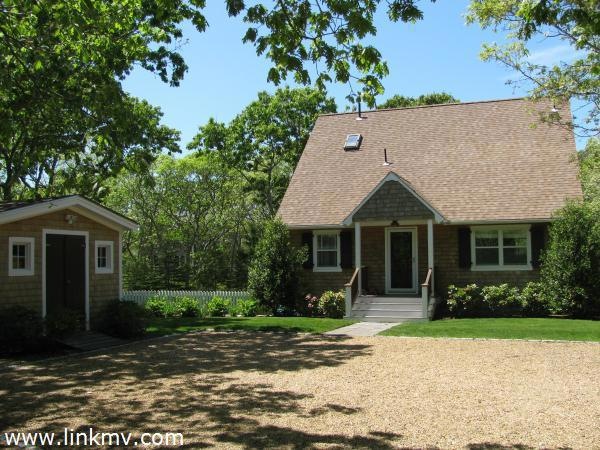
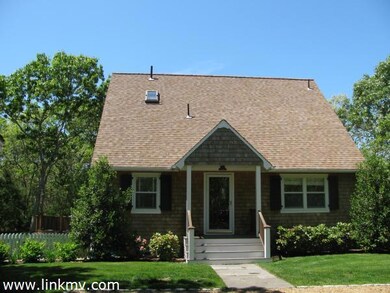
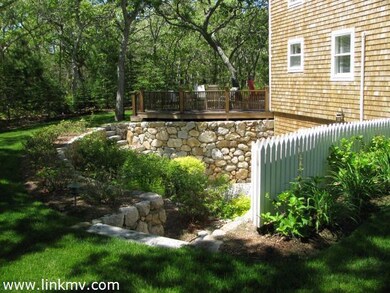
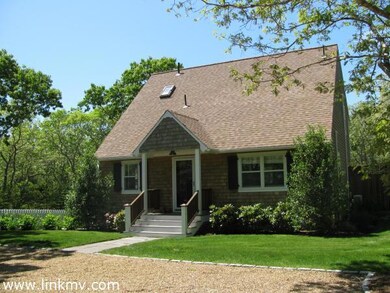
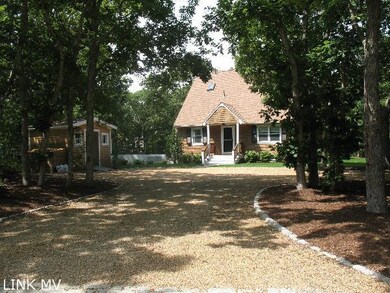
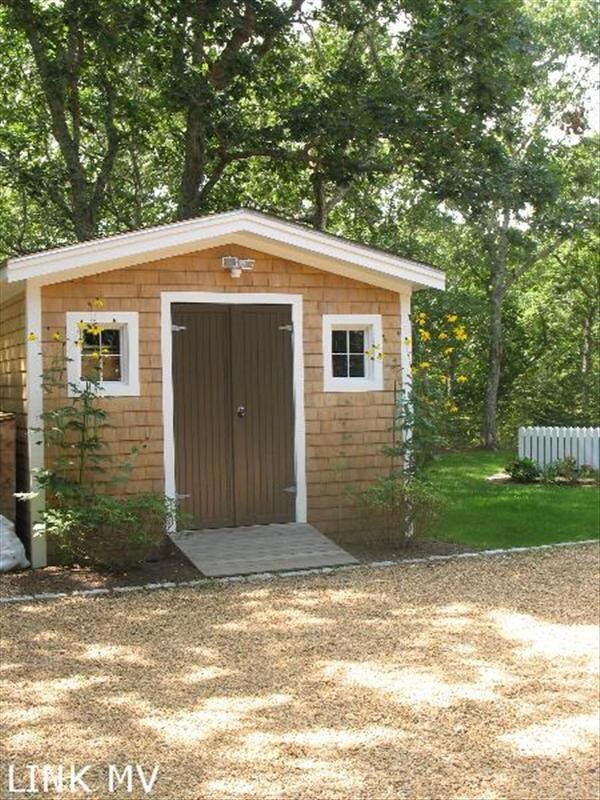
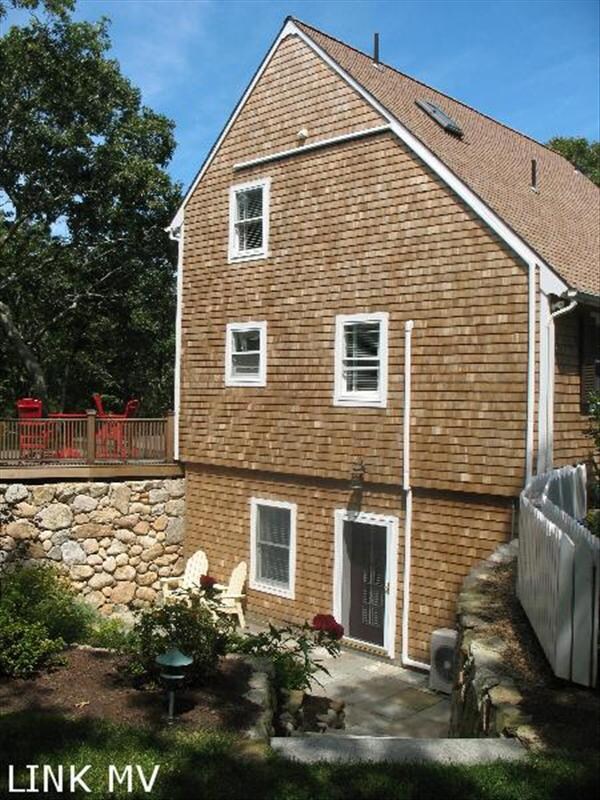
Meticulously cared for home with easy access to the bike path. Every inch of this Post & Beam home has been thoughtfully renovated. Some of the amenities include a first floor master bedroom, wood floors, updated kitchen, high ceilings, walk-out basement with extra living spaces & home office. This 3 bedroom home is nestled on a private lot with beautiful landscaping, stone gardens, large mahogany deck with outdoor shower & granite steps leading to a bluestone patio. Large shed for bikes & garden tools. Close to Long Point Beach. A must see at this new price!
Last Agent to Sell the Property
Alyssa Halisky
Wallace & Co. Sotheby's Listed on: 02/01/2012
Last Buyer's Agent
Candy DaRosa
Feiner Real Estate
| Date | Buyer | Sale Price | Title Company |
|---|---|---|---|
| Bloom David E | $580,000 | -- | |
| Bakes George D | $563,000 | -- | |
| Morano Joseph | $385,000 | -- | |
| Krause Michael C | $199,900 | -- | |
| Fdic | $31,250 | -- |
| Date | Status | Borrower | Loan Amount |
|---|---|---|---|
| Open | Fdic | $456,625 | |
| Closed | Fdic | $464,000 | |
| Previous Owner | Fdic | $179,910 |
| Date | Event | Price | List to Sale | Price per Sq Ft |
|---|---|---|---|---|
| 08/21/2012 08/21/12 | Sold | $580,000 | -7.2% | $284 / Sq Ft |
| 07/11/2012 07/11/12 | Pending | -- | -- | -- |
| 02/01/2012 02/01/12 | For Sale | $625,000 | -- | $306 / Sq Ft |
| Year | Tax Paid | Tax Assessment Tax Assessment Total Assessment is a certain percentage of the fair market value that is determined by local assessors to be the total taxable value of land and additions on the property. | Land | Improvement |
|---|---|---|---|---|
| 2025 | $2,768 | $1,044,400 | $336,400 | $708,000 |
| 2024 | $2,348 | $920,900 | $336,400 | $584,500 |
| 2023 | $2,429 | $963,900 | $368,500 | $595,400 |
| 2022 | $2,413 | $796,300 | $352,500 | $443,800 |
| 2021 | $2,602 | $793,400 | $349,600 | $443,800 |
| 2020 | $2,306 | $688,500 | $320,500 | $368,000 |
| 2019 | $2,635 | $680,900 | $291,300 | $389,600 |
| 2018 | $2,396 | $619,100 | $291,300 | $327,800 |
| 2017 | $2,010 | $566,200 | $291,300 | $274,900 |
| 2016 | $1,950 | $538,600 | $284,800 | $253,800 |
| 2015 | $1,744 | $502,600 | $284,800 | $217,800 |
A
Seller's Agent in 2012
Alyssa Halisky
Wallace & Co. Sotheby's
C
Buyer's Agent in 2012
Candy DaRosa
Feiner Real Estate
Source: LINK (Vineyard)
MLS Number: 22554
APN: EDGA-000011-000001-000342