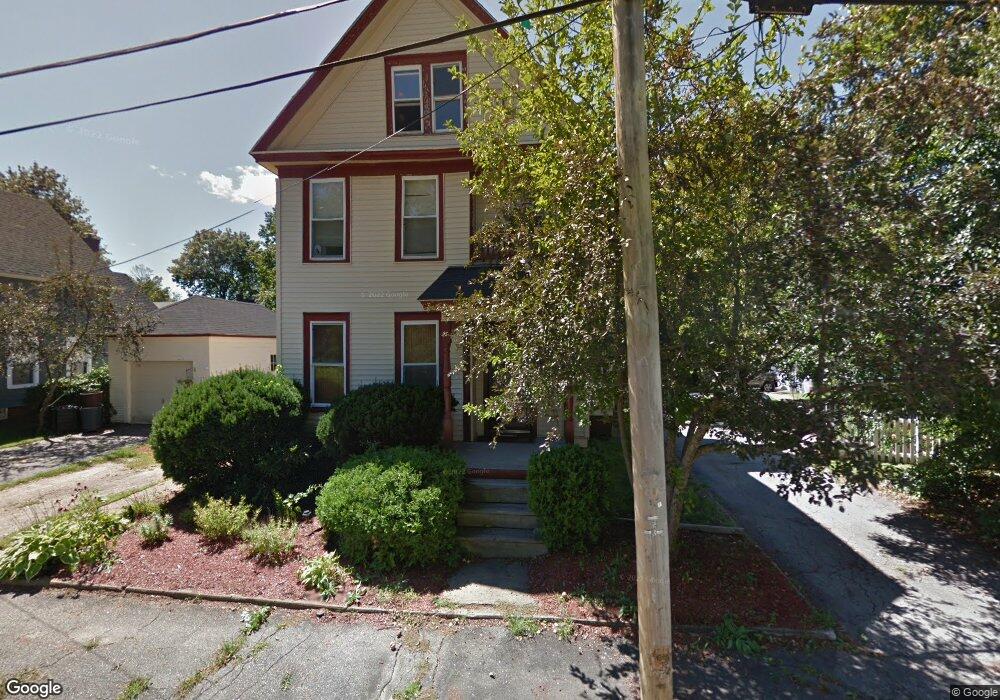
6 Glen St Concord, NH 03301
South End NeighborhoodEstimated Value: $494,780 - $557,000
4
Beds
2
Baths
1,933
Sq Ft
$270/Sq Ft
Est. Value
About This Home
This home is located at 6 Glen St, Concord, NH 03301 and is currently estimated at $521,945, approximately $270 per square foot. 6 Glen St is a home located in Merrimack County with nearby schools including Abbot-Downing School, Rundlett Middle School, and Concord High School.
Ownership History
Date
Name
Owned For
Owner Type
Purchase Details
Closed on
Aug 1, 2003
Sold by
Dinapoli Rhonda M
Bought by
Burns Joseph J and Burns Kelli
Current Estimated Value
Home Financials for this Owner
Home Financials are based on the most recent Mortgage that was taken out on this home.
Original Mortgage
$104,000
Interest Rate
5.28%
Mortgage Type
Purchase Money Mortgage
Create a Home Valuation Report for This Property
The Home Valuation Report is an in-depth analysis detailing your home's value as well as a comparison with similar homes in the area
Home Values in the Area
Average Home Value in this Area
Purchase History
| Date | Buyer | Sale Price | Title Company |
|---|---|---|---|
| Burns Joseph J | $199,000 | -- |
Source: Public Records
Mortgage History
| Date | Status | Borrower | Loan Amount |
|---|---|---|---|
| Open | Burns Joseph J | $193,000 | |
| Closed | Burns Joseph J | $171,000 | |
| Closed | Burns Joseph J | $104,000 |
Source: Public Records
Tax History Compared to Growth
Tax History
| Year | Tax Paid | Tax Assessment Tax Assessment Total Assessment is a certain percentage of the fair market value that is determined by local assessors to be the total taxable value of land and additions on the property. | Land | Improvement |
|---|---|---|---|---|
| 2024 | $8,717 | $314,800 | $103,800 | $211,000 |
| 2023 | $8,456 | $314,800 | $103,800 | $211,000 |
| 2022 | $8,150 | $314,800 | $103,800 | $211,000 |
| 2021 | $7,858 | $312,800 | $103,800 | $209,000 |
| 2020 | $7,768 | $290,300 | $86,800 | $203,500 |
| 2019 | $7,492 | $269,700 | $85,100 | $184,600 |
| 2018 | $6,932 | $245,900 | $81,800 | $164,100 |
| 2017 | $6,569 | $232,600 | $80,300 | $152,300 |
| 2016 | $6,159 | $222,600 | $80,300 | $142,300 |
| 2015 | $4,192 | $212,200 | $73,000 | $139,200 |
| 2014 | $5,689 | $212,200 | $73,000 | $139,200 |
| 2013 | -- | $210,900 | $73,000 | $137,900 |
| 2012 | -- | $222,300 | $73,000 | $149,300 |
Source: Public Records
Map
Nearby Homes
- 0 Spruce St Unit 88
- 33 Spruce St
- 24 Badger St
- 12 Avon St
- 14 Downing St
- 122 South St
- 47 South St
- 105 S Main St
- 14-16 Perley St
- 10 Perley St
- 87 S Main St Unit 2
- 0 South St Unit 4969509
- 4 Fayette St
- 54 Pleasant St Unit 8
- 15 Wilson Ave
- 22 Wilson Ave
- 376 S Main St
- 2 Kensington Rd
- 17 Essex St
- 1 Kensington Rd