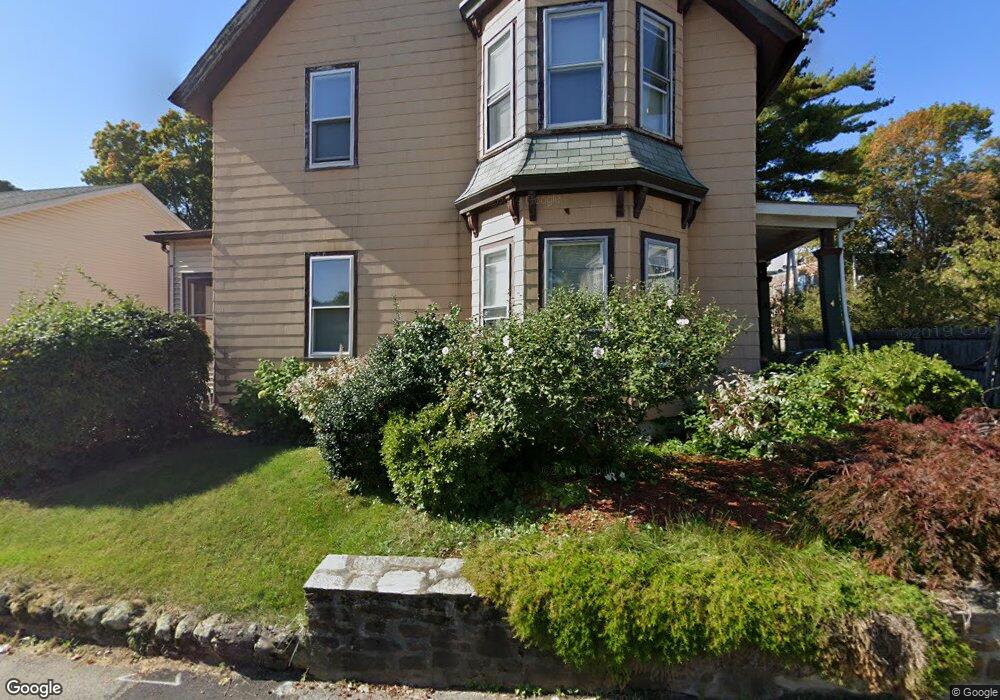
6 Hancock St Worcester, MA 01610
Beacon Brightly NeighborhoodEstimated Value: $233,000 - $372,000
3
Beds
2
Baths
2,280
Sq Ft
$127/Sq Ft
Est. Value
About This Home
This home is located at 6 Hancock St, Worcester, MA 01610 and is currently estimated at $289,692, approximately $127 per square foot. 6 Hancock St is a home located in Worcester County with nearby schools including Jacob Hiatt Magnet School, Chandler Magnet, and University Park Campus School.
Ownership History
Date
Name
Owned For
Owner Type
Purchase Details
Closed on
Jun 15, 2022
Sold by
Laflin Reva
Bought by
Trinity Est Investmenets
Current Estimated Value
Home Financials for this Owner
Home Financials are based on the most recent Mortgage that was taken out on this home.
Original Mortgage
$162,000
Outstanding Balance
$153,259
Interest Rate
5.27%
Mortgage Type
Purchase Money Mortgage
Estimated Equity
$136,433
Purchase Details
Closed on
Feb 4, 2009
Sold by
Countrywide Gp Llc and Countrywide Home Loans
Bought by
Laflin Reva
Home Financials for this Owner
Home Financials are based on the most recent Mortgage that was taken out on this home.
Original Mortgage
$61,750
Interest Rate
5.2%
Mortgage Type
Purchase Money Mortgage
Purchase Details
Closed on
Jan 22, 2008
Sold by
Nixon Shafron B and Mers
Bought by
Bank Of New York
Purchase Details
Closed on
Nov 30, 2000
Sold by
Doherty Sarah O Est and Doherty
Bought by
Nixon Shafron B
Home Financials for this Owner
Home Financials are based on the most recent Mortgage that was taken out on this home.
Original Mortgage
$55,190
Interest Rate
7.76%
Mortgage Type
Purchase Money Mortgage
Create a Home Valuation Report for This Property
The Home Valuation Report is an in-depth analysis detailing your home's value as well as a comparison with similar homes in the area
Home Values in the Area
Average Home Value in this Area
Purchase History
| Date | Buyer | Sale Price | Title Company |
|---|---|---|---|
| Trinity Est Investmenets | $202,500 | None Available | |
| Laflin Reva | $65,000 | -- | |
| Laflin Reva | $65,000 | -- | |
| Bank Of New York | $185,492 | -- | |
| Bank Of New York | $185,492 | -- | |
| Nixon Shafron B | $56,900 | -- |
Source: Public Records
Mortgage History
| Date | Status | Borrower | Loan Amount |
|---|---|---|---|
| Open | Trinity Est Investmenets | $162,000 | |
| Previous Owner | Laflin Reva | $61,750 | |
| Previous Owner | Nixon Shafron B | $61,300 | |
| Previous Owner | Nixon Shafron B | $55,190 |
Source: Public Records
Tax History
| Year | Tax Paid | Tax Assessment Tax Assessment Total Assessment is a certain percentage of the fair market value that is determined by local assessors to be the total taxable value of land and additions on the property. | Land | Improvement |
|---|---|---|---|---|
| 2025 | $3,180 | $241,100 | $39,300 | $201,800 |
| 2024 | $2,980 | $216,700 | $39,300 | $177,400 |
| 2023 | $2,798 | $195,100 | $31,000 | $164,100 |
| 2022 | $2,536 | $166,700 | $24,800 | $141,900 |
| 2021 | $2,566 | $157,600 | $19,900 | $137,700 |
| 2020 | $2,479 | $145,800 | $19,900 | $125,900 |
| 2019 | $2,405 | $133,600 | $18,900 | $114,700 |
| 2018 | $2,392 | $126,500 | $18,900 | $107,600 |
| 2017 | $2,239 | $116,500 | $18,900 | $97,600 |
| 2016 | $2,255 | $109,400 | $13,900 | $95,500 |
| 2015 | $2,196 | $109,400 | $13,900 | $95,500 |
| 2014 | $2,138 | $109,400 | $13,900 | $95,500 |
Source: Public Records
Map
Nearby Homes
Your Personal Tour Guide
Ask me questions while you tour the home.