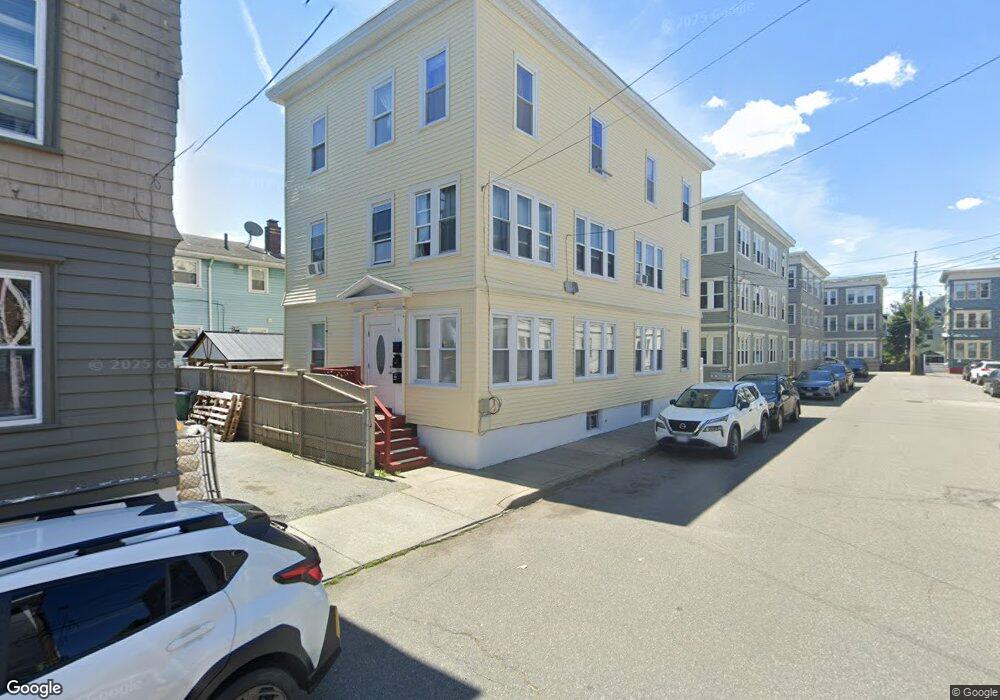
6 Hanover Cir Lynn, MA 01902
Central Lynn NeighborhoodEstimated Value: $668,000 - $832,000
6
Beds
3
Baths
3,243
Sq Ft
$229/Sq Ft
Est. Value
About This Home
This home is located at 6 Hanover Cir, Lynn, MA 01902 and is currently estimated at $743,738, approximately $229 per square foot. 6 Hanover Cir is a home located in Essex County with nearby schools including Washington Elementary School, William R. Fallon School, and Fecteau-Leary Junior/Senior High School.
Ownership History
Date
Name
Owned For
Owner Type
Purchase Details
Closed on
Jun 2, 2017
Sold by
Crisostomo Juan S
Bought by
Lebron Meris M
Current Estimated Value
Home Financials for this Owner
Home Financials are based on the most recent Mortgage that was taken out on this home.
Original Mortgage
$400,610
Outstanding Balance
$330,731
Interest Rate
3.75%
Mortgage Type
FHA
Estimated Equity
$413,007
Purchase Details
Closed on
Mar 30, 1999
Sold by
Stone Jolanta and Stone Christopher
Bought by
Crisostomo Juan S
Purchase Details
Closed on
Dec 6, 1996
Sold by
Fhlmc
Bought by
Stone Jolanta and Stone Christopher
Purchase Details
Closed on
Aug 23, 1996
Sold by
Thimotee Raymond and Source One Mtg Service
Bought by
Fhlmc
Purchase Details
Closed on
Jan 30, 1987
Sold by
Landry Ernest A
Bought by
Thimotee Raymond
Create a Home Valuation Report for This Property
The Home Valuation Report is an in-depth analysis detailing your home's value as well as a comparison with similar homes in the area
Home Values in the Area
Average Home Value in this Area
Purchase History
| Date | Buyer | Sale Price | Title Company |
|---|---|---|---|
| Lebron Meris M | $408,000 | -- | |
| Crisostomo Juan S | $122,000 | -- | |
| Stone Jolanta | $65,000 | -- | |
| Fhlmc | $62,000 | -- | |
| Thimotee Raymond | $168,000 | -- |
Source: Public Records
Mortgage History
| Date | Status | Borrower | Loan Amount |
|---|---|---|---|
| Open | Lebron Meris M | $400,610 | |
| Previous Owner | Thimotee Raymond | $290,500 | |
| Previous Owner | Thimotee Raymond | $240,000 | |
| Previous Owner | Thimotee Raymond | $158,900 |
Source: Public Records
Tax History
| Year | Tax Paid | Tax Assessment Tax Assessment Total Assessment is a certain percentage of the fair market value that is determined by local assessors to be the total taxable value of land and additions on the property. | Land | Improvement |
|---|---|---|---|---|
| 2025 | $7,692 | $742,500 | $182,100 | $560,400 |
| 2024 | $7,684 | $729,700 | $175,600 | $554,100 |
| 2023 | $7,051 | $632,400 | $138,400 | $494,000 |
| 2022 | $7,035 | $566,000 | $125,000 | $441,000 |
| 2021 | $6,670 | $511,900 | $110,900 | $401,000 |
| 2020 | $6,332 | $472,500 | $104,400 | $368,100 |
| 2019 | $6,017 | $420,800 | $88,200 | $332,600 |
| 2018 | $5,584 | $368,600 | $87,400 | $281,200 |
| 2017 | $5,320 | $341,000 | $76,900 | $264,100 |
| 2016 | $4,744 | $293,200 | $57,900 | $235,300 |
| 2015 | $4,278 | $255,400 | $55,000 | $200,400 |
Source: Public Records
Map
Nearby Homes
- 43 Baker St
- 81A Franklin St
- 50 S Common St Unit 508
- 50 S Common St Unit 405
- 121 Johnson St Unit 3L
- 10 Pleasant St Unit 205
- 99 Franklin St
- 57 Johnson St
- 66 Harwood St
- 191-193 Washington St
- 136 Franklin St
- 589 Essex St Unit 102
- 45 Henry Ave
- 25 Hamilton Ave
- 51 Laighton St Unit 7
- 105 Lawton Ave
- 274 Boston St
- 102 Henry Ave
- 6-8 Beede Ave
- 199 Allen Ave
- 12 Hanover Cir
- 22 Hanover St
- 26 Hanover St
- 26 Hanover St
- 26 Hanover St Unit 2
- 7 Hanover Cir
- 7 Hanover Cir Unit 3
- 7 Hanover Cir Unit 2
- 30 Hanover St
- 11 Hanover Cir
- 16 Hanover St
- 18 Hanover Cir
- 18 Hanover Cir Unit 3
- 18 Hanover Cir Unit 1
- 18 Hanover Cir Unit 2
- 73 N Common St
- 73 N Common St Unit 12
- 73 N Common St Unit 9
- 73 N Common St Unit 2
- 73 N Common St Unit 7
Your Personal Tour Guide
Ask me questions while you tour the home.