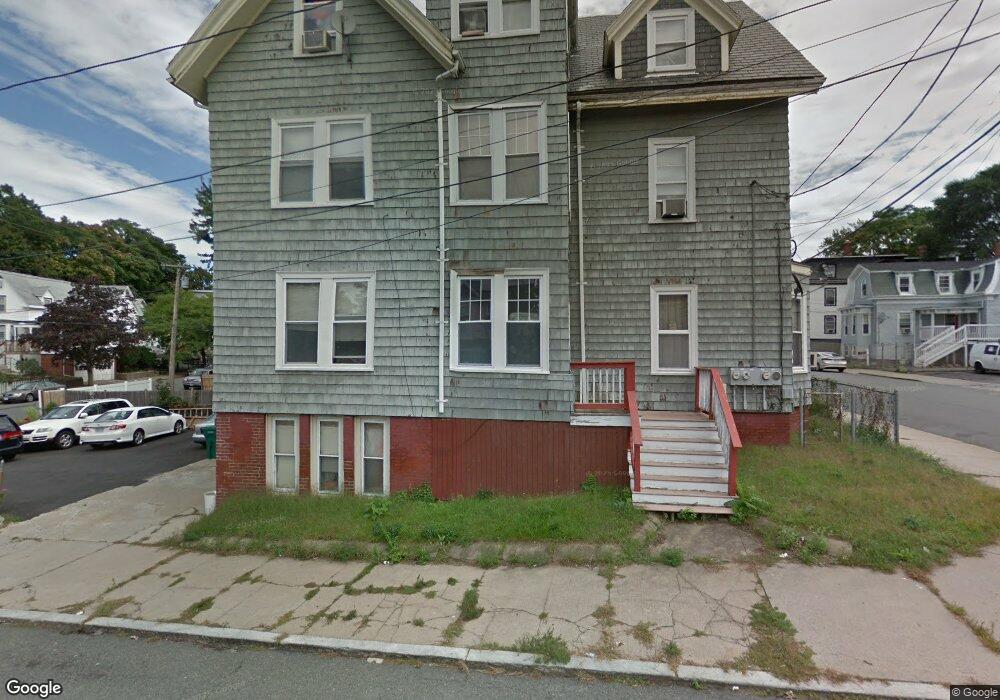
6 Herbert St Lynn, MA 01902
Highlands NeighborhoodEstimated Value: $936,000 - $1,134,000
6
Beds
4
Baths
3,986
Sq Ft
$256/Sq Ft
Est. Value
About This Home
This home is located at 6 Herbert St, Lynn, MA 01902 and is currently estimated at $1,018,667, approximately $255 per square foot. 6 Herbert St is a home located in Essex County with nearby schools including Robert L. Ford Elementary School, William R. Fallon School, and Fecteau-Leary Junior/Senior High School.
Ownership History
Date
Name
Owned For
Owner Type
Purchase Details
Closed on
Feb 7, 2019
Sold by
Sout-Sorm Kate T
Bought by
Sorm Sean S and Sout-Sorm Kate T
Current Estimated Value
Home Financials for this Owner
Home Financials are based on the most recent Mortgage that was taken out on this home.
Original Mortgage
$307,000
Outstanding Balance
$268,256
Interest Rate
4.4%
Mortgage Type
New Conventional
Estimated Equity
$750,411
Purchase Details
Closed on
Feb 18, 2000
Sold by
Department Of Housing & Urban Dev
Bought by
Sout Tum K
Purchase Details
Closed on
Apr 23, 1998
Sold by
Leblanc Gary R and Magna Mtg Co
Bought by
Magna Mtg Co
Purchase Details
Closed on
Sep 19, 1990
Sold by
Johnston John D
Bought by
Leblanc Keith J
Create a Home Valuation Report for This Property
The Home Valuation Report is an in-depth analysis detailing your home's value as well as a comparison with similar homes in the area
Home Values in the Area
Average Home Value in this Area
Purchase History
| Date | Buyer | Sale Price | Title Company |
|---|---|---|---|
| Sorm Sean S | -- | -- | |
| Sorm Sean S | -- | -- | |
| Sout Tum K | $121,999 | -- | |
| Sout Tum K | $121,999 | -- | |
| Magna Mtg Co | $160,606 | -- | |
| Magna Mtg Co | $160,606 | -- | |
| Leblanc Keith J | $116,416 | -- | |
| Leblanc Keith J | $23,283 | -- | |
| Leblanc Keith J | $23,283 | -- |
Source: Public Records
Mortgage History
| Date | Status | Borrower | Loan Amount |
|---|---|---|---|
| Open | Sorm Sean S | $307,000 | |
| Closed | Sorm Sean S | $307,000 | |
| Previous Owner | Leblanc Keith J | $50,000 |
Source: Public Records
Tax History
| Year | Tax Paid | Tax Assessment Tax Assessment Total Assessment is a certain percentage of the fair market value that is determined by local assessors to be the total taxable value of land and additions on the property. | Land | Improvement |
|---|---|---|---|---|
| 2025 | $10,756 | $1,038,200 | $195,700 | $842,500 |
| 2024 | $10,750 | $1,020,900 | $188,800 | $832,100 |
| 2023 | $9,931 | $890,700 | $148,700 | $742,000 |
| 2022 | $9,908 | $797,100 | $134,400 | $662,700 |
| 2021 | $9,406 | $721,900 | $119,200 | $602,700 |
| 2020 | $8,919 | $665,600 | $112,200 | $553,400 |
| 2019 | $8,509 | $595,000 | $94,800 | $500,200 |
| 2018 | $7,834 | $517,100 | $93,900 | $423,200 |
| 2017 | $7,482 | $479,600 | $82,600 | $397,000 |
| 2016 | $6,732 | $416,100 | $62,200 | $353,900 |
| 2015 | $6,042 | $360,700 | $59,200 | $301,500 |
Source: Public Records
Map
Nearby Homes
- 67 Beacon Hill Ave
- 6-8 Beede Ave
- 199 Allen Ave
- 105 Lawton Ave
- 14 Valley Ave
- 25 Hamilton Ave
- 10 Valley Ave
- 69 Hollingsworth St Unit 69A
- 135 Allen Ave
- 102 Henry Ave
- 102 Rockaway St
- 15 Nichols Ave
- 191-193 Washington St
- 131 Adams St
- 51 Laighton St Unit 7
- 57 Johnson St
- 589 Essex St Unit 102
- 70 Grant St
- 345 Western Ave
- 121 Johnson St Unit 3L
- 109 Hollingsworth St
- 107 Hollingsworth St
- 107 Hollingsworth St Unit 1
- 1 Herbert St Unit B
- 1 Herbert St Unit A
- 1 Herbert St Unit 1A
- 113 Hamilton Ave
- 110 Hollingsworth St Unit 2
- 110 Hollingsworth St
- 3 Herbert St Unit B
- 3 Herbert St Unit A
- 3 Herbert St Unit 3 A
- 112 Hollingsworth St
- 112 Hollingsworth St Unit 5
- 112 Hollingsworth St Unit 2
- 103 Hollingsworth St
- 115 Hamilton Ave
- 98 Hamilton Ave
- 106 Hamilton Ave
- 106 Hollingsworth St
Your Personal Tour Guide
Ask me questions while you tour the home.