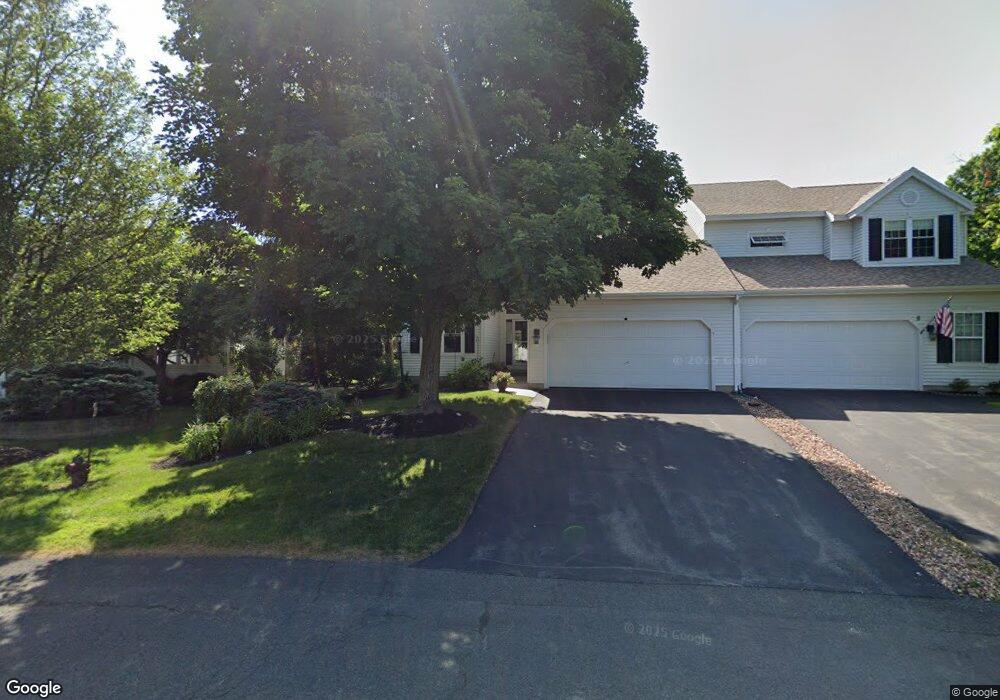
6 Hyland Cir Troy, NY 12182
Lansingburgh NeighborhoodEstimated Value: $328,000 - $364,000
2
Beds
2
Baths
1,684
Sq Ft
$205/Sq Ft
Est. Value
About This Home
This home is located at 6 Hyland Cir, Troy, NY 12182 and is currently estimated at $345,677, approximately $205 per square foot. 6 Hyland Cir is a home located in Rensselaer County with nearby schools including Turnpike Elementary School, Rensselaer Park Elementary School, and Knickerbacker Middle School.
Ownership History
Date
Name
Owned For
Owner Type
Purchase Details
Closed on
Oct 22, 2024
Sold by
Dessingue Janice
Bought by
Janice L Dessingue Irt and Dessingue
Current Estimated Value
Purchase Details
Closed on
Mar 13, 2024
Sold by
Dessingue Family Irt and Dessingue
Bought by
Dessingue John W and Dessingue Janice
Purchase Details
Closed on
Dec 8, 2022
Sold by
Dessingue John W and Dessingue Janice
Bought by
Dessingue Family Irt and Dessingue
Purchase Details
Closed on
Aug 28, 2014
Sold by
Mackey Bernard J
Bought by
Dessingue John W and Dessingue D
Purchase Details
Closed on
Mar 28, 1997
Sold by
The Michaels Development
Bought by
Mackey Bernard and Mackey Donna
Create a Home Valuation Report for This Property
The Home Valuation Report is an in-depth analysis detailing your home's value as well as a comparison with similar homes in the area
Home Values in the Area
Average Home Value in this Area
Purchase History
| Date | Buyer | Sale Price | Title Company |
|---|---|---|---|
| Janice L Dessingue Irt | -- | None Available | |
| Janice L Dessingue Irt | -- | None Available | |
| Dessingue John W | -- | None Available | |
| Dessingue John W | -- | None Available | |
| Dessingue Family Irt | -- | None Available | |
| Dessingue Family Irt | -- | None Available | |
| Dessingue Family Irt | -- | None Available | |
| Dessingue John W | $195,000 | Sharon Freyer | |
| Dessingue John W | $195,000 | Sharon Freyer | |
| Mackey Bernard | $132,000 | -- | |
| Mackey Bernard | $132,000 | -- |
Source: Public Records
Tax History Compared to Growth
Tax History
| Year | Tax Paid | Tax Assessment Tax Assessment Total Assessment is a certain percentage of the fair market value that is determined by local assessors to be the total taxable value of land and additions on the property. | Land | Improvement |
|---|---|---|---|---|
| 2024 | $3,460 | $175,000 | $30,000 | $145,000 |
| 2023 | $7,046 | $175,000 | $30,000 | $145,000 |
| 2022 | $3,244 | $175,000 | $30,000 | $145,000 |
| 2021 | $1,555 | $175,000 | $30,000 | $145,000 |
| 2020 | $3,607 | $175,000 | $30,000 | $145,000 |
| 2019 | $2,905 | $175,000 | $30,000 | $145,000 |
| 2018 | $4,961 | $175,000 | $30,000 | $145,000 |
| 2017 | $6,916 | $175,000 | $30,000 | $145,000 |
| 2016 | $6,323 | $175,000 | $30,000 | $145,000 |
| 2015 | -- | $175,000 | $30,000 | $145,000 |
| 2014 | -- | $175,000 | $30,000 | $145,000 |
Source: Public Records
Map
Nearby Homes