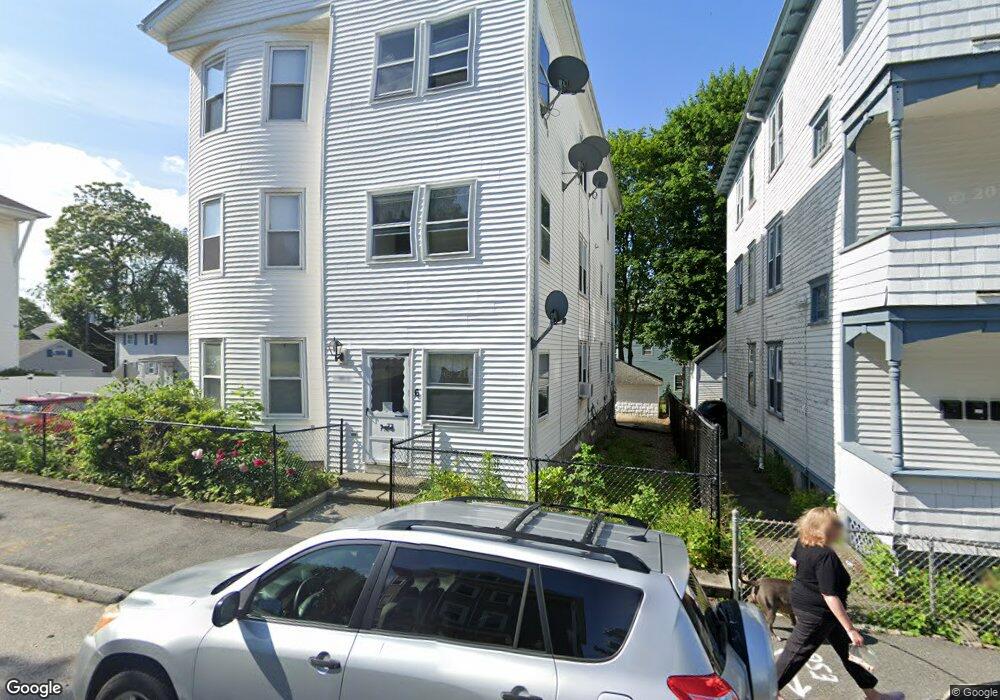
6 Mars St Worcester, MA 01607
Vernon Hill NeighborhoodEstimated Value: $527,974 - $784,000
9
Beds
3
Baths
3,388
Sq Ft
$200/Sq Ft
Est. Value
About This Home
This home is located at 6 Mars St, Worcester, MA 01607 and is currently estimated at $678,994, approximately $200 per square foot. 6 Mars St is a home located in Worcester County with nearby schools including Vernon Hill Elementary School, Jacob Hiatt Magnet School, and Chandler Magnet.
Ownership History
Date
Name
Owned For
Owner Type
Purchase Details
Closed on
May 23, 2016
Sold by
Rodriguez Angel L
Bought by
Rodriguez Angel L and Rodriguez Yasmin
Current Estimated Value
Purchase Details
Closed on
Jan 30, 2008
Sold by
Brothers Securitizatio
Bought by
Rodriguez Angel L
Home Financials for this Owner
Home Financials are based on the most recent Mortgage that was taken out on this home.
Original Mortgage
$255,983
Interest Rate
6.18%
Mortgage Type
Purchase Money Mortgage
Purchase Details
Closed on
Sep 18, 2007
Sold by
Filho Ostilio C
Bought by
Us Bk
Purchase Details
Closed on
Aug 15, 2005
Sold by
Fenuccio Ruth M Est
Bought by
Filho Ostilio C
Home Financials for this Owner
Home Financials are based on the most recent Mortgage that was taken out on this home.
Original Mortgage
$381,900
Interest Rate
5.54%
Mortgage Type
Purchase Money Mortgage
Create a Home Valuation Report for This Property
The Home Valuation Report is an in-depth analysis detailing your home's value as well as a comparison with similar homes in the area
Home Values in the Area
Average Home Value in this Area
Purchase History
| Date | Buyer | Sale Price | Title Company |
|---|---|---|---|
| Rodriguez Angel L | -- | -- | |
| Rodriguez Angel L | $260,000 | -- | |
| Us Bk | $208,250 | -- | |
| Filho Ostilio C | $402,000 | -- |
Source: Public Records
Mortgage History
| Date | Status | Borrower | Loan Amount |
|---|---|---|---|
| Previous Owner | Rodriguez Angel L | $255,983 | |
| Previous Owner | Filho Ostilio C | $381,900 |
Source: Public Records
Tax History
| Year | Tax Paid | Tax Assessment Tax Assessment Total Assessment is a certain percentage of the fair market value that is determined by local assessors to be the total taxable value of land and additions on the property. | Land | Improvement |
|---|---|---|---|---|
| 2025 | $8,901 | $674,800 | $81,200 | $593,600 |
| 2024 | $8,183 | $595,100 | $81,200 | $513,900 |
| 2023 | $7,858 | $548,000 | $70,600 | $477,400 |
| 2022 | $6,858 | $450,900 | $56,500 | $394,400 |
| 2021 | $6,059 | $372,200 | $45,200 | $327,000 |
| 2020 | $5,593 | $329,000 | $44,900 | $284,100 |
| 2019 | $4,797 | $266,500 | $39,200 | $227,300 |
| 2018 | $4,690 | $248,000 | $39,200 | $208,800 |
| 2017 | $4,399 | $228,900 | $39,200 | $189,700 |
| 2016 | $4,223 | $204,900 | $28,300 | $176,600 |
| 2015 | $4,112 | $204,900 | $28,300 | $176,600 |
| 2014 | $4,004 | $204,900 | $28,300 | $176,600 |
Source: Public Records
Map
Nearby Homes
- 7 Lund St
- 6 Lund St
- 74 Esther St
- 32 Ames St
- 9 1/2 Ames St Unit 2
- 17 Fairbanks St
- 26 Maxwell St
- 93 Fairfax Rd
- 4 Maxwell Ct
- 3A Gediminas St
- 20 Bolton St
- 172 Perry Ave Unit 1A
- 172 Perry Ave Unit 2B
- 41 Bridgeport St
- 32 Granite St
- 13 Sterling St
- 47 Gibbs St
- 607 Cambridge St Unit 4
- 26 South St
- 30 Ekman St
Your Personal Tour Guide
Ask me questions while you tour the home.