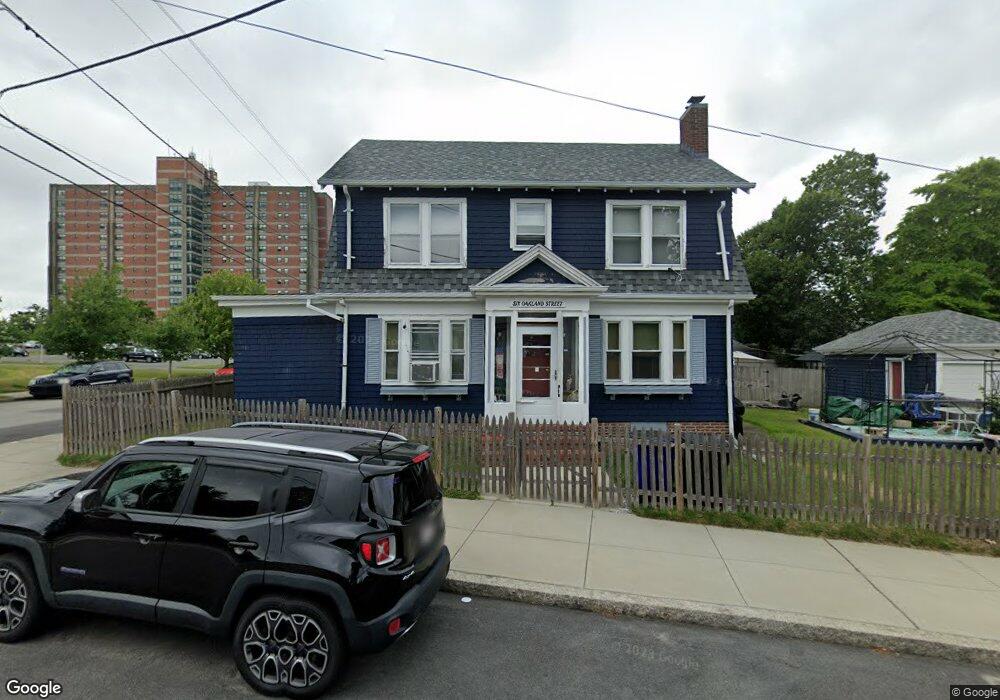
6 Oakland St Fall River, MA 02720
Highlands-Fall River NeighborhoodEstimated Value: $443,000 - $582,000
4
Beds
2
Baths
1,662
Sq Ft
$290/Sq Ft
Est. Value
About This Home
This home is located at 6 Oakland St, Fall River, MA 02720 and is currently estimated at $481,869, approximately $289 per square foot. 6 Oakland St is a home located in Bristol County with nearby schools including James Tansey Elementary School, Morton Middle School, and B M C Durfee High School.
Ownership History
Date
Name
Owned For
Owner Type
Purchase Details
Closed on
Feb 2, 2021
Sold by
Rice Christiane E and Rice Jessica M
Bought by
Rice Christine E
Current Estimated Value
Purchase Details
Closed on
May 27, 2015
Sold by
Rice Christine E
Bought by
Rice Christine E and Rice Jessica M
Home Financials for this Owner
Home Financials are based on the most recent Mortgage that was taken out on this home.
Original Mortgage
$162,500
Interest Rate
3.65%
Mortgage Type
New Conventional
Purchase Details
Closed on
Mar 25, 2011
Sold by
Silva Dennis D and Silva Bernadette
Bought by
Rice Christine E
Home Financials for this Owner
Home Financials are based on the most recent Mortgage that was taken out on this home.
Original Mortgage
$143,420
Interest Rate
5.07%
Mortgage Type
Purchase Money Mortgage
Create a Home Valuation Report for This Property
The Home Valuation Report is an in-depth analysis detailing your home's value as well as a comparison with similar homes in the area
Home Values in the Area
Average Home Value in this Area
Purchase History
| Date | Buyer | Sale Price | Title Company |
|---|---|---|---|
| Rice Christine E | -- | None Available | |
| Rice Christine E | -- | -- | |
| Rice Christine E | $155,000 | -- |
Source: Public Records
Mortgage History
| Date | Status | Borrower | Loan Amount |
|---|---|---|---|
| Previous Owner | Rice Christine E | $162,500 | |
| Previous Owner | Rice Christine E | $142,190 | |
| Previous Owner | Rice Christine E | $143,420 | |
| Previous Owner | Rice Christine E | $100,000 | |
| Previous Owner | Rice Christine E | $60,000 |
Source: Public Records
Tax History Compared to Growth
Tax History
| Year | Tax Paid | Tax Assessment Tax Assessment Total Assessment is a certain percentage of the fair market value that is determined by local assessors to be the total taxable value of land and additions on the property. | Land | Improvement |
|---|---|---|---|---|
| 2025 | $4,259 | $372,000 | $131,900 | $240,100 |
| 2024 | $4,001 | $348,200 | $126,800 | $221,400 |
| 2023 | $3,978 | $324,200 | $113,800 | $210,400 |
| 2022 | $3,545 | $280,900 | $105,400 | $175,500 |
| 2021 | $3,647 | $263,700 | $99,500 | $164,200 |
| 2020 | $3,605 | $249,500 | $95,800 | $153,700 |
| 2019 | $3,549 | $243,400 | $95,800 | $147,600 |
| 2018 | $3,387 | $231,700 | $95,800 | $135,900 |
| 2017 | $3,210 | $229,300 | $95,800 | $133,500 |
| 2016 | $3,018 | $221,400 | $95,800 | $125,600 |
| 2015 | $2,815 | $215,200 | $89,600 | $125,600 |
| 2014 | -- | $215,200 | $89,600 | $125,600 |
Source: Public Records
Map
Nearby Homes
- 1353 Robeson St
- 499 Madison St
- 303 Florence St
- 270 Garden St
- 1268 President Ave
- 153 Ray St
- 208 Florence St
- 884-886 Robeson St
- 333 Langley St
- 49 Farnham St
- 1247 Highland Ave
- 213 Weetamoe St
- 342 Stetson St
- 108 Garden St
- 247 Albany St
- 160 Stewart St
- 376 N Underwood St
- 131 Stewart St Unit 2
- 131 Stewart St Unit 3A
- 509 N Belmont St