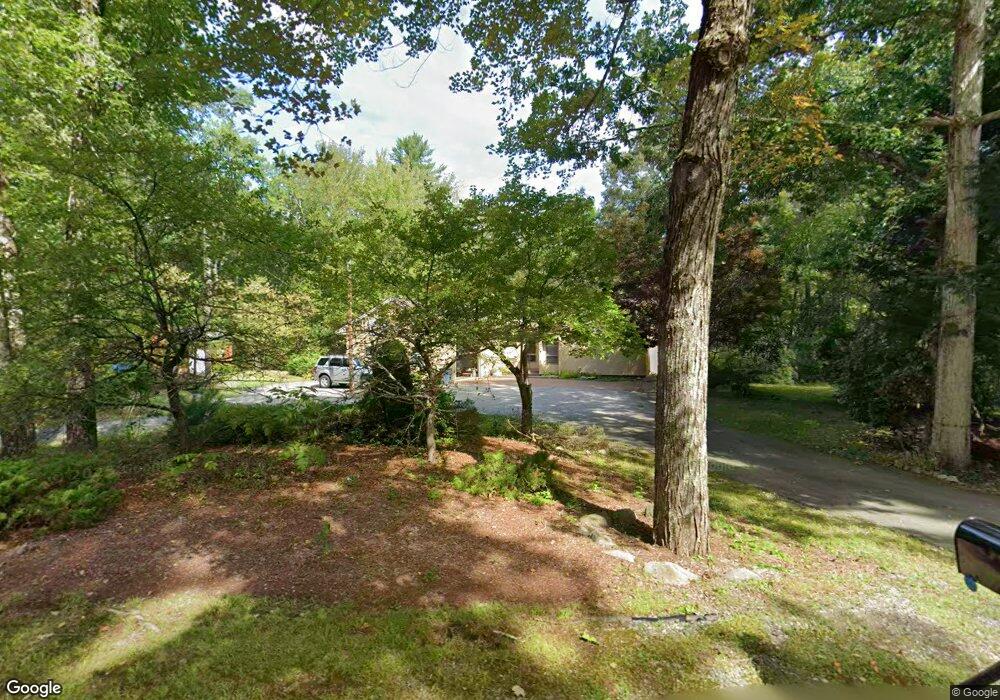
6 Parker Rd Brookline, NH 03033
Estimated Value: $534,000 - $582,000
3
Beds
2
Baths
2,175
Sq Ft
$259/Sq Ft
Est. Value
About This Home
This home is located at 6 Parker Rd, Brookline, NH 03033 and is currently estimated at $562,652, approximately $258 per square foot. 6 Parker Rd is a home located in Hillsborough County with nearby schools including Richard Maghakian Memorial School, Captain Samuel Douglass Academy, and Hollis-Brookline Middle School.
Ownership History
Date
Name
Owned For
Owner Type
Purchase Details
Closed on
Jul 2, 2010
Sold by
Antosh Paul D
Bought by
Passamonte David S
Current Estimated Value
Home Financials for this Owner
Home Financials are based on the most recent Mortgage that was taken out on this home.
Original Mortgage
$237,731
Outstanding Balance
$156,774
Interest Rate
4.88%
Mortgage Type
Purchase Money Mortgage
Estimated Equity
$405,878
Purchase Details
Closed on
Sep 9, 2002
Sold by
Vaccaro Matthew W and Vaccaro Diana G
Bought by
Antosh Paul D
Home Financials for this Owner
Home Financials are based on the most recent Mortgage that was taken out on this home.
Original Mortgage
$226,960
Interest Rate
6.39%
Purchase Details
Closed on
Jun 28, 1999
Sold by
Croteau Richard L and Croteau Francine L
Bought by
Vaccaro Matthew W and Vaccaro Diana G
Home Financials for this Owner
Home Financials are based on the most recent Mortgage that was taken out on this home.
Original Mortgage
$197,950
Interest Rate
7.09%
Create a Home Valuation Report for This Property
The Home Valuation Report is an in-depth analysis detailing your home's value as well as a comparison with similar homes in the area
Home Values in the Area
Average Home Value in this Area
Purchase History
| Date | Buyer | Sale Price | Title Company |
|---|---|---|---|
| Passamonte David S | $255,000 | -- | |
| Antosh Paul D | $288,700 | -- | |
| Vaccaro Matthew W | $208,400 | -- |
Source: Public Records
Mortgage History
| Date | Status | Borrower | Loan Amount |
|---|---|---|---|
| Open | Vaccaro Matthew W | $237,731 | |
| Previous Owner | Vaccaro Matthew W | $226,960 | |
| Previous Owner | Vaccaro Matthew W | $197,950 |
Source: Public Records
Tax History
| Year | Tax Paid | Tax Assessment Tax Assessment Total Assessment is a certain percentage of the fair market value that is determined by local assessors to be the total taxable value of land and additions on the property. | Land | Improvement |
|---|---|---|---|---|
| 2025 | $12,492 | $507,000 | $197,000 | $310,000 |
| 2024 | $11,463 | $507,000 | $197,000 | $310,000 |
| 2023 | $10,494 | $505,000 | $197,000 | $308,000 |
| 2022 | $9,347 | $314,500 | $118,300 | $196,200 |
| 2021 | $8,988 | $314,500 | $118,300 | $196,200 |
| 2020 | $8,743 | $314,500 | $118,300 | $196,200 |
| 2019 | $9,394 | $314,500 | $118,300 | $196,200 |
| 2018 | $9,297 | $314,500 | $118,300 | $196,200 |
| 2017 | $8,446 | $256,400 | $93,800 | $162,600 |
| 2016 | $8,075 | $248,000 | $93,800 | $154,200 |
| 2015 | $7,700 | $248,000 | $93,800 | $154,200 |
| 2014 | $8,147 | $248,000 | $93,800 | $154,200 |
| 2013 | $7,844 | $248,000 | $93,800 | $154,200 |
Source: Public Records
Map
Nearby Homes
- 9 Quigley Way
- 198 N End Rd
- 6 Skyline Dr
- 25 Pepperell Rd
- 6 High Oaks Path
- 2 Corey Hill Rd
- 6 Flint Meadow Dr
- 364 Townsend Hill Rd
- 15 N End Rd
- 7 Winterberry Rd
- 3 Winterberry Rd
- 9 Winterberry Rd
- 2 Warren's Way
- 8B Louis Dr
- 0 Brookline St
- 102 Wheeler St
- 10 Boynton St
- 143 Heald St
- 127 Brookline St
- 18 Maple St Unit 14
Your Personal Tour Guide
Ask me questions while you tour the home.