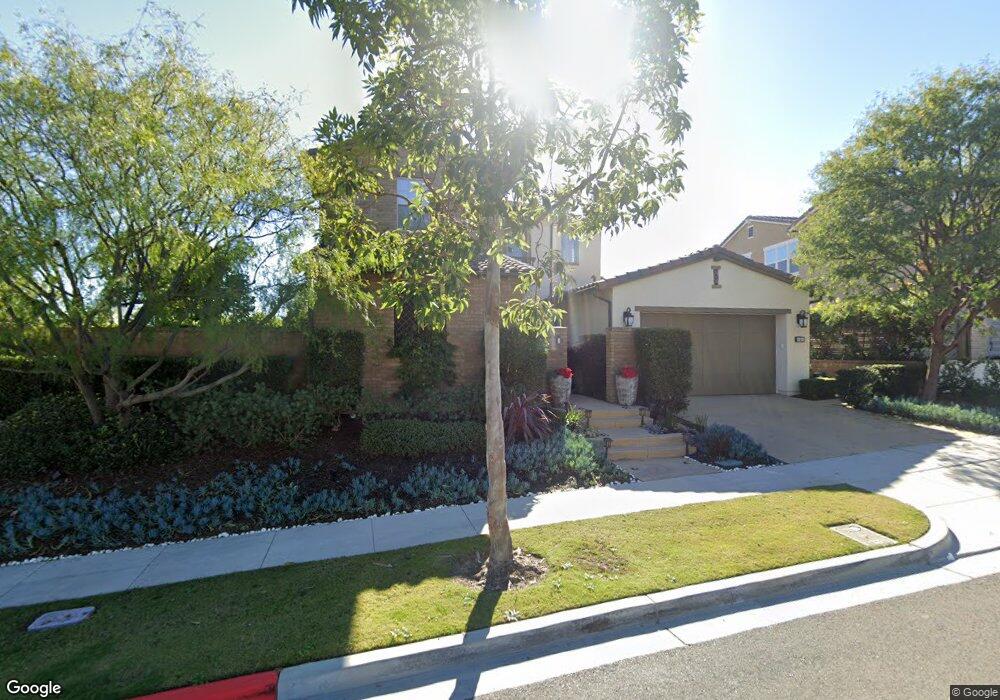
6 Puro Way Rancho Mission Viejo, CA 92694
Estimated Value: $2,265,396 - $2,410,000
3
Beds
4
Baths
3,140
Sq Ft
$744/Sq Ft
Est. Value
About This Home
This home is located at 6 Puro Way, Rancho Mission Viejo, CA 92694 and is currently estimated at $2,337,099, approximately $744 per square foot. 6 Puro Way is a home with nearby schools including Esencia and Tesoro High School.
Ownership History
Date
Name
Owned For
Owner Type
Purchase Details
Closed on
Nov 14, 2018
Sold by
Lt Mr23 Llc
Bought by
Damour Joseph Henry and Damour Simone Hernandez
Current Estimated Value
Home Financials for this Owner
Home Financials are based on the most recent Mortgage that was taken out on this home.
Original Mortgage
$1,201,500
Outstanding Balance
$1,057,976
Interest Rate
4.87%
Mortgage Type
Adjustable Rate Mortgage/ARM
Estimated Equity
$1,279,123
Purchase Details
Closed on
Sep 15, 2017
Sold by
Lt Mr23 Llc
Bought by
Rancho Misson Viejo Master Maintenance C
Create a Home Valuation Report for This Property
The Home Valuation Report is an in-depth analysis detailing your home's value as well as a comparison with similar homes in the area
Home Values in the Area
Average Home Value in this Area
Purchase History
| Date | Buyer | Sale Price | Title Company |
|---|---|---|---|
| Damour Joseph Henry | $1,335,000 | First American Title Co | |
| Rancho Misson Viejo Master Maintenance C | -- | First American Title Co |
Source: Public Records
Mortgage History
| Date | Status | Borrower | Loan Amount |
|---|---|---|---|
| Open | Damour Joseph Henry | $1,201,500 |
Source: Public Records
Tax History Compared to Growth
Tax History
| Year | Tax Paid | Tax Assessment Tax Assessment Total Assessment is a certain percentage of the fair market value that is determined by local assessors to be the total taxable value of land and additions on the property. | Land | Improvement |
|---|---|---|---|---|
| 2025 | $23,344 | $1,489,216 | $817,900 | $671,316 |
| 2024 | $23,344 | $1,460,016 | $801,863 | $658,153 |
| 2023 | $23,228 | $1,431,389 | $786,140 | $645,249 |
| 2022 | $22,820 | $1,403,323 | $770,725 | $632,598 |
| 2021 | $22,510 | $1,375,807 | $755,612 | $620,195 |
| 2020 | $22,071 | $1,361,700 | $747,864 | $613,836 |
| 2019 | $23,008 | $1,335,000 | $733,200 | $601,800 |
| 2018 | $19,738 | $1,014,265 | $456,303 | $557,962 |
| 2017 | $13,978 | $447,356 | $447,356 | $0 |
Source: Public Records
Map
Nearby Homes