K
Seller's Agent in 2021
Kathy Sollitto
Karen M. Overtoom R.E.


Estimated Value: $1,463,000 - $1,536,000
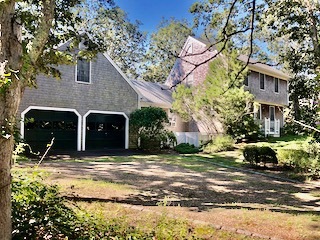
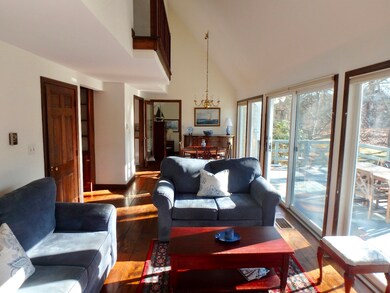
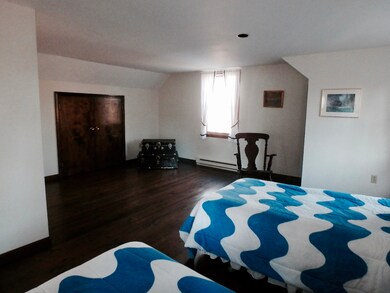
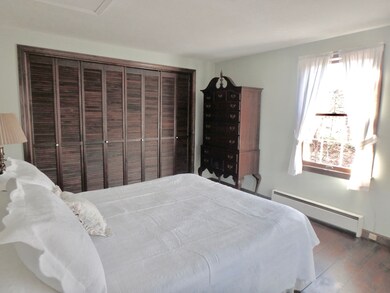
This cozy 4BR, 3BA saltbox offers two living areas with lots of light , a galley kitchen and spacious 4th bedroom with ensuite bath located over the attached 2-car garage. This great space also lends itself to use as a home office, studio, or private master bedroom suite. Additional features of this home include a vaulted living/ dining area, 1st floor bedroom , hardwood floors throughout,generous rear deck and full walk out basement. Conveniently located with easy access to the bike path and just minutes from downtown Edgartown.*New Roof in 2020
Last Agent to Sell the Property
Kathy Sollitto
Karen M. Overtoom R.E. Listed on: 12/03/2020
Last Buyer's Agent
Susan Wallo
Compass | The O'Hanlon Group
| Date | Buyer | Sale Price | Title Company |
|---|---|---|---|
| Chesney Alexander | $910,000 | None Available | |
| Carpenter H Glenn | -- | -- |
| Date | Status | Borrower | Loan Amount |
|---|---|---|---|
| Open | Chesney Alexander | $728,000 |
| Date | Event | Price | List to Sale | Price per Sq Ft |
|---|---|---|---|---|
| 01/21/2021 01/21/21 | Sold | $910,000 | +5.8% | $453 / Sq Ft |
| 12/08/2020 12/08/20 | Pending | -- | -- | -- |
| 12/03/2020 12/03/20 | For Sale | $859,900 | -- | $428 / Sq Ft |
| Year | Tax Paid | Tax Assessment Tax Assessment Total Assessment is a certain percentage of the fair market value that is determined by local assessors to be the total taxable value of land and additions on the property. | Land | Improvement |
|---|---|---|---|---|
| 2025 | $2,853 | $1,076,700 | $345,500 | $731,200 |
| 2024 | $2,421 | $949,600 | $345,500 | $604,100 |
| 2023 | $2,341 | $928,800 | $313,500 | $615,300 |
| 2022 | $2,567 | $847,200 | $313,500 | $533,700 |
| 2021 | $2,779 | $847,200 | $313,500 | $533,700 |
| 2020 | $2,435 | $727,000 | $285,000 | $442,000 |
| 2019 | $2,915 | $753,200 | $285,000 | $468,200 |
| 2018 | $2,697 | $696,900 | $285,000 | $411,900 |
| 2017 | $2,135 | $601,500 | $285,000 | $316,500 |
| 2016 | $2,074 | $572,900 | $281,000 | $291,900 |
| 2015 | $1,843 | $531,100 | $281,000 | $250,100 |
K
Seller's Agent in 2021
Kathy Sollitto
Karen M. Overtoom R.E.
S
Buyer's Agent in 2021
Susan Wallo
Compass | The O'Hanlon Group
Source: LINK (Vineyard)
MLS Number: 37202
APN: EDGA-000011-000039
Ask me questions while you tour the home.