Estimated Value: $84,000 - $183,000
3
Beds
1
Bath
1,509
Sq Ft
$91/Sq Ft
Est. Value
About This Home
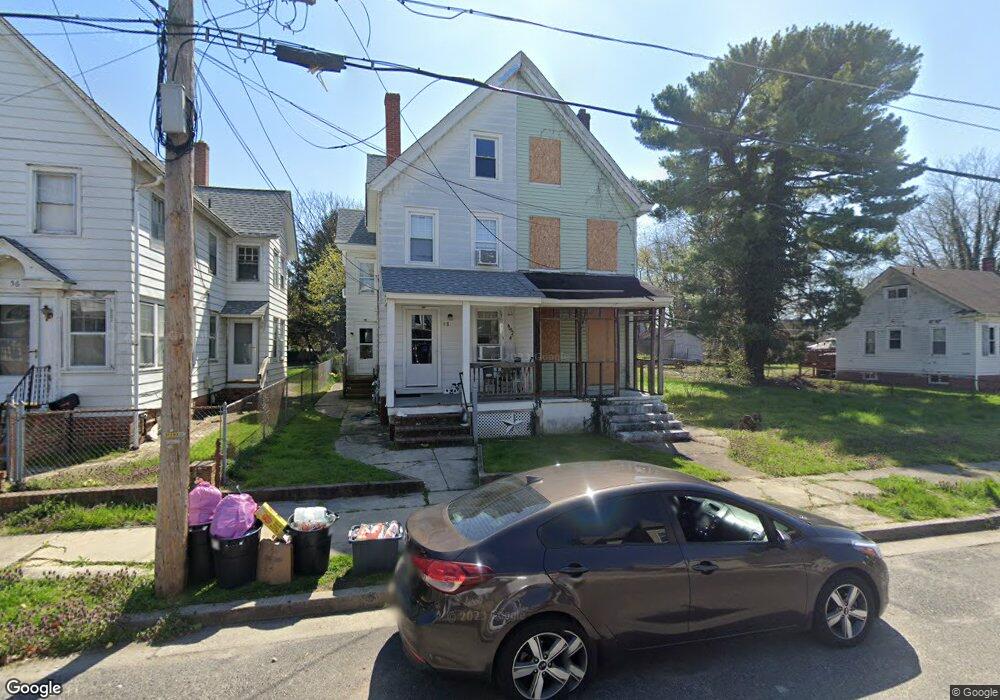
This home is located at 60 7th St, Salem, NJ 08079 and is currently estimated at $137,971, approximately $91 per square foot. 60 7th St is a home located in Salem County with nearby schools including John Fenwick Elementary School, Salem Middle School, and Salem High School.
Ownership History
Date
Name
Owned For
Owner Type
Purchase Details
Closed on
Jan 24, 2017
Sold by
Victor Margaret A
Bought by
Willis Charisse N
Current Estimated Value
Purchase Details
Closed on
Feb 19, 2012
Sold by
Gunther Constance L
Bought by
Victor Margaret A
Purchase Details
Closed on
Feb 24, 2011
Sold by
Gunther Nikkia C
Bought by
Gunther Constance L
Purchase Details
Closed on
Nov 20, 2006
Sold by
Glen Avenue Holdings Llc
Bought by
Johnson David
Purchase Details
Closed on
Jun 27, 2006
Sold by
Mooring Tax Asset Group Llc
Bought by
Glen Avenue Holdings Llc
Create a Home Valuation Report for This Property
The Home Valuation Report is an in-depth analysis detailing your home's value as well as a comparison with similar homes in the area
Home Values in the Area
Average Home Value in this Area
Purchase History
| Date | Buyer | Sale Price | Title Company |
|---|---|---|---|
| Willis Charisse N | -- | None Available | |
| Willis Charisse N | -- | None Available | |
| Victor Margaret A | -- | -- | |
| Gunther Constance L | -- | -- | |
| Johnson David | $30,000 | American Title Abstract Corp | |
| Glen Avenue Holdings Llc | $22,500 | Fortune Title Agency Inc |
Source: Public Records
Tax History
| Year | Tax Paid | Tax Assessment Tax Assessment Total Assessment is a certain percentage of the fair market value that is determined by local assessors to be the total taxable value of land and additions on the property. | Land | Improvement |
|---|---|---|---|---|
| 2025 | $2,393 | $29,100 | $10,900 | $18,200 |
| 2024 | $2,288 | $29,100 | $10,900 | $18,200 |
Source: Public Records
Map
Nearby Homes
Your Personal Tour Guide
Ask me questions while you tour the home.