60 Chickering Rd Lawrence, MA 01843
Colonial Heights NeighborhoodEstimated Value: $544,000 - $633,000
4
Beds
2
Baths
1,642
Sq Ft
$352/Sq Ft
Est. Value
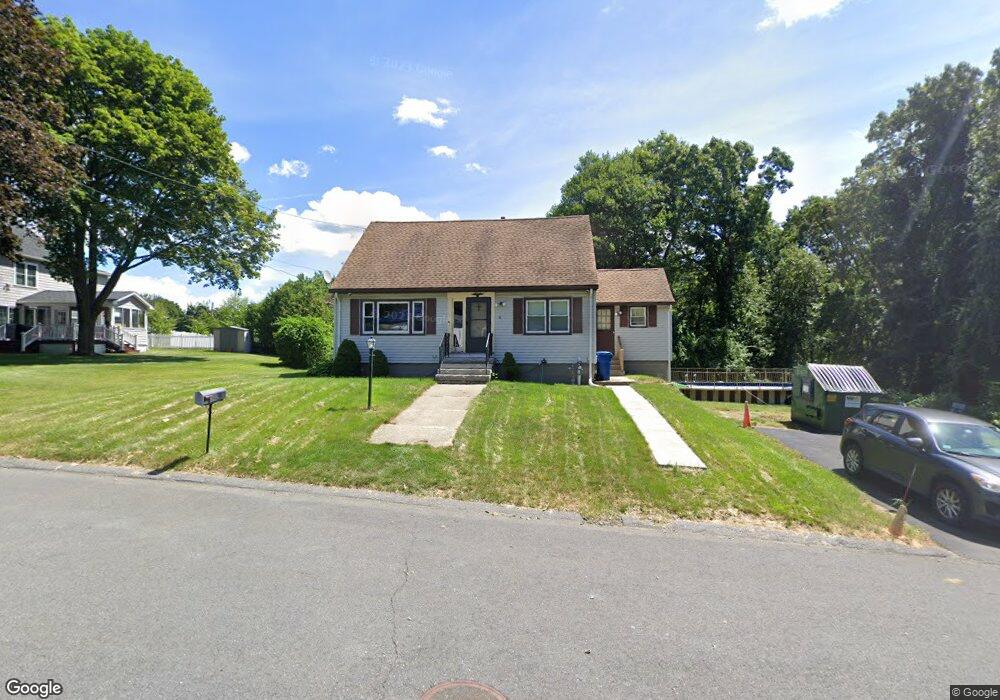
About This Home
This home is located at 60 Chickering Rd, Lawrence, MA 01843 and is currently estimated at $578,201, approximately $352 per square foot. 60 Chickering Rd is a home located in Essex County with nearby schools including John Breen School, South Lawrence East Elementary School, and School For Exceptional Studies.
Ownership History
Date
Name
Owned For
Owner Type
Purchase Details
Closed on
Dec 19, 2007
Sold by
Deutsche Bank Natl T C
Bought by
Torres Jose and Torres Iveliz
Current Estimated Value
Home Financials for this Owner
Home Financials are based on the most recent Mortgage that was taken out on this home.
Original Mortgage
$223,236
Interest Rate
6.3%
Mortgage Type
Purchase Money Mortgage
Purchase Details
Closed on
Nov 30, 2007
Sold by
Flynn Maynard S
Bought by
Deutsche Bank Natl T C
Home Financials for this Owner
Home Financials are based on the most recent Mortgage that was taken out on this home.
Original Mortgage
$223,236
Interest Rate
6.3%
Mortgage Type
Purchase Money Mortgage
Purchase Details
Closed on
Apr 25, 1997
Sold by
Corey Denise M
Bought by
Flynn Maynard S
Purchase Details
Closed on
Nov 10, 1994
Sold by
Mcdonnell John W
Bought by
Corey Denise M
Create a Home Valuation Report for This Property
The Home Valuation Report is an in-depth analysis detailing your home's value as well as a comparison with similar homes in the area
Home Values in the Area
Average Home Value in this Area
Purchase History
| Date | Buyer | Sale Price | Title Company |
|---|---|---|---|
| Torres Jose | $225,000 | -- | |
| Deutsche Bank Natl T C | $219,000 | -- | |
| Flynn Maynard S | $117,500 | -- | |
| Corey Denise M | $115,000 | -- |
Source: Public Records
Mortgage History
| Date | Status | Borrower | Loan Amount |
|---|---|---|---|
| Open | Corey Denise M | $228,850 | |
| Closed | Torres Jose | $223,236 | |
| Previous Owner | Corey Denise M | $36,202 |
Source: Public Records
Tax History
| Year | Tax Paid | Tax Assessment Tax Assessment Total Assessment is a certain percentage of the fair market value that is determined by local assessors to be the total taxable value of land and additions on the property. | Land | Improvement |
|---|---|---|---|---|
| 2025 | $4,198 | $477,000 | $166,100 | $310,900 |
| 2024 | $3,907 | $422,400 | $145,100 | $277,300 |
| 2023 | $4,123 | $405,800 | $145,100 | $260,700 |
| 2022 | $4,013 | $350,800 | $129,500 | $221,300 |
| 2021 | $3,755 | $306,000 | $125,400 | $180,600 |
| 2020 | $3,504 | $281,900 | $107,700 | $174,200 |
| 2019 | $3,670 | $268,300 | $110,900 | $157,400 |
| 2018 | $3,579 | $249,900 | $108,900 | $141,000 |
| 2017 | $3,464 | $225,800 | $106,000 | $119,800 |
| 2016 | $3,055 | $197,000 | $76,000 | $121,000 |
| 2015 | $2,827 | $187,000 | $66,000 | $121,000 |
Source: Public Records
Map
Nearby Homes
- 12B Stevens St
- 102 Weare St
- 28 Stirling St
- 341 S Broadway- Parcel II
- 24 Inman St Unit 4
- 42 York St
- 27-29 Dorchester St
- 356-360 S Union St
- 46-46A Dorchester St
- 87-87A Brookfield St
- 31 Garfield St
- 354 N Main St Unit 204
- 11 W Hawley St
- 350 Greene St Unit 410
- 350 Greene St Unit 305
- 91-93 Andover St
- 119 Andover St
- 10 Dartmouth Rd
- 16 Balmoral St Unit 214
- 17 Carisbrooke St
Your Personal Tour Guide
Ask me questions while you tour the home.