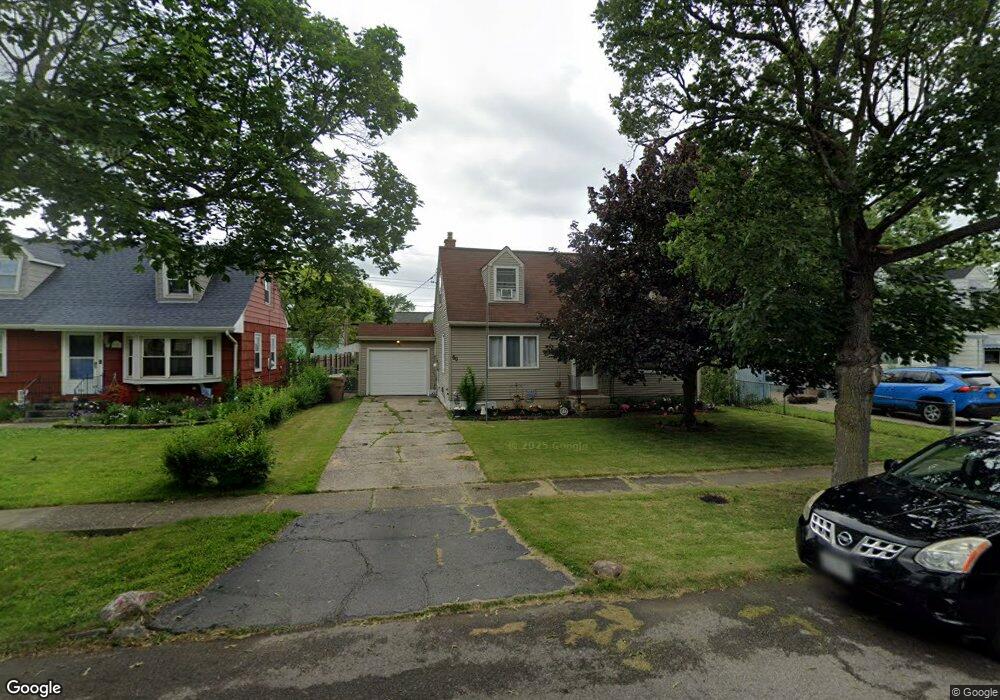
60 Milsom Ave Buffalo, NY 14227
South Cheektowaga NeighborhoodEstimated Value: $176,000 - $194,000
4
Beds
1
Bath
930
Sq Ft
$199/Sq Ft
Est. Value
About This Home
This home is located at 60 Milsom Ave, Buffalo, NY 14227 and is currently estimated at $184,827, approximately $198 per square foot. 60 Milsom Ave is a home located in Erie County with nearby schools including Theodore Roosevelt School, Woodrow Wilson Elementary School, and John F Kennedy Middle School.
Ownership History
Date
Name
Owned For
Owner Type
Purchase Details
Closed on
Jan 12, 2024
Sold by
King Melissa A
Bought by
King Melissa A and Wanat John P
Current Estimated Value
Purchase Details
Closed on
Sep 11, 2009
Sold by
Mueller Charles J and Kiel Pamela Ann
Bought by
King Melissa A
Home Financials for this Owner
Home Financials are based on the most recent Mortgage that was taken out on this home.
Original Mortgage
$45,000
Outstanding Balance
$29,444
Interest Rate
5.36%
Mortgage Type
New Conventional
Estimated Equity
$155,383
Purchase Details
Closed on
Aug 24, 2008
Sold by
Mueller Charles J
Bought by
Mueller Charles J and Kiel Pamela Ann
Create a Home Valuation Report for This Property
The Home Valuation Report is an in-depth analysis detailing your home's value as well as a comparison with similar homes in the area
Home Values in the Area
Average Home Value in this Area
Purchase History
| Date | Buyer | Sale Price | Title Company |
|---|---|---|---|
| King Melissa A | -- | None Available | |
| King Melissa A | -- | None Available | |
| King Melissa A | -- | None Available | |
| King Melissa A | $66,000 | None Available | |
| King Melissa A | $66,000 | None Available | |
| King Melissa A | $66,000 | None Available | |
| Mueller Charles J | -- | None Available | |
| Mueller Charles J | -- | None Available | |
| Mueller Charles J | -- | None Available |
Source: Public Records
Mortgage History
| Date | Status | Borrower | Loan Amount |
|---|---|---|---|
| Open | King Melissa A | $45,000 | |
| Closed | King Melissa A | $45,000 |
Source: Public Records
Tax History
| Year | Tax Paid | Tax Assessment Tax Assessment Total Assessment is a certain percentage of the fair market value that is determined by local assessors to be the total taxable value of land and additions on the property. | Land | Improvement |
|---|---|---|---|---|
| 2024 | $5,321 | $141,000 | $12,000 | $129,000 |
| 2023 | $5,097 | $141,000 | $12,000 | $129,000 |
| 2022 | $5,023 | $141,000 | $12,000 | $129,000 |
| 2021 | $4,978 | $123,000 | $12,000 | $111,000 |
| 2020 | $3,339 | $70,000 | $9,700 | $60,300 |
| 2019 | $3,052 | $70,000 | $9,700 | $60,300 |
| 2018 | $3,109 | $70,000 | $9,700 | $60,300 |
| 2017 | $1,760 | $70,000 | $9,700 | $60,300 |
| 2016 | $3,032 | $70,000 | $9,700 | $60,300 |
| 2015 | -- | $70,000 | $9,700 | $60,300 |
| 2014 | -- | $70,000 | $9,700 | $60,300 |
Source: Public Records
Map
Nearby Homes
Your Personal Tour Guide
Ask me questions while you tour the home.