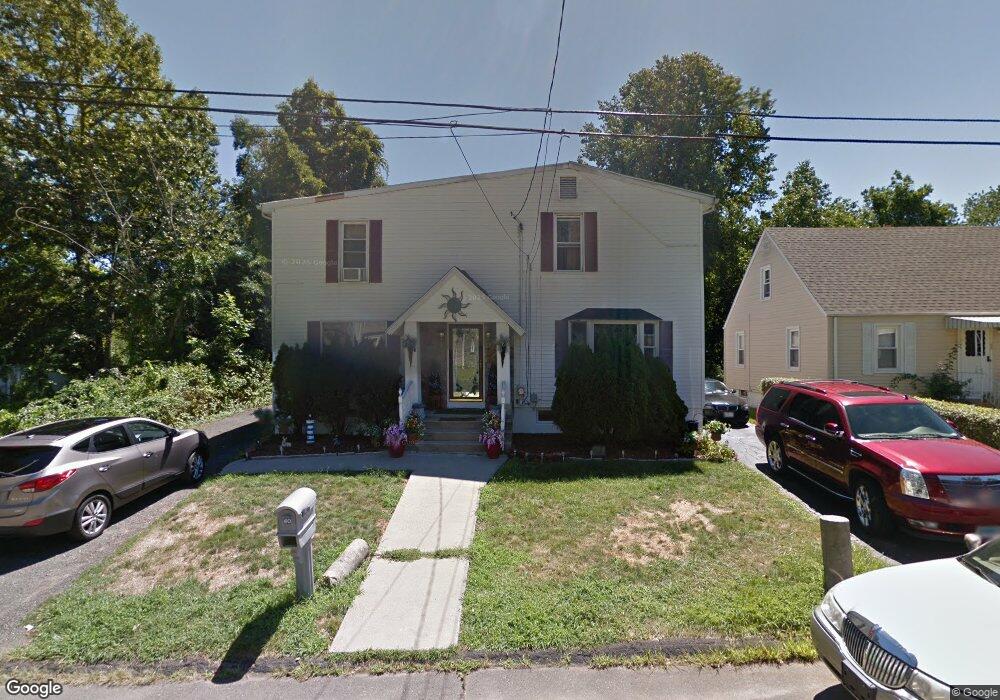
60 Ormond St West Haven, CT 06516
Allingtown NeighborhoodEstimated Value: $406,000 - $487,000
5
Beds
2
Baths
2,536
Sq Ft
$172/Sq Ft
Est. Value
About This Home
This home is located at 60 Ormond St, West Haven, CT 06516 and is currently estimated at $437,000, approximately $172 per square foot. 60 Ormond St is a home located in New Haven County with nearby schools including Carrigan 5/6 Intermediate School, Harry M. Bailey Middle School, and West Haven High School.
Ownership History
Date
Name
Owned For
Owner Type
Purchase Details
Closed on
Nov 24, 2008
Sold by
Patrick Patricia
Bought by
Davis Eric C
Current Estimated Value
Home Financials for this Owner
Home Financials are based on the most recent Mortgage that was taken out on this home.
Original Mortgage
$212,100
Interest Rate
6.03%
Mortgage Type
Purchase Money Mortgage
Purchase Details
Closed on
May 18, 1989
Sold by
Manganella Elayne M
Bought by
Everson Roger W
Create a Home Valuation Report for This Property
The Home Valuation Report is an in-depth analysis detailing your home's value as well as a comparison with similar homes in the area
Home Values in the Area
Average Home Value in this Area
Purchase History
| Date | Buyer | Sale Price | Title Company |
|---|---|---|---|
| Davis Eric C | $215,000 | -- | |
| Davis Eric C | $215,000 | -- | |
| Everson Roger W | $107,000 | -- |
Source: Public Records
Mortgage History
| Date | Status | Borrower | Loan Amount |
|---|---|---|---|
| Open | Everson Roger W | $226,910 | |
| Closed | Everson Roger W | $228,759 | |
| Closed | Everson Roger W | $212,100 |
Source: Public Records
Tax History
| Year | Tax Paid | Tax Assessment Tax Assessment Total Assessment is a certain percentage of the fair market value that is determined by local assessors to be the total taxable value of land and additions on the property. | Land | Improvement |
|---|---|---|---|---|
| 2025 | $9,042 | $265,860 | $61,740 | $204,120 |
| 2024 | $8,857 | $184,940 | $42,770 | $142,170 |
| 2023 | $8,585 | $184,940 | $42,770 | $142,170 |
| 2022 | $8,435 | $184,940 | $42,770 | $142,170 |
| 2021 | $8,437 | $184,940 | $42,770 | $142,170 |
| 2020 | $8,266 | $160,510 | $34,580 | $125,930 |
| 2019 | $8,138 | $160,510 | $34,580 | $125,930 |
| 2018 | $7,916 | $160,510 | $34,580 | $125,930 |
| 2017 | $7,669 | $160,510 | $34,580 | $125,930 |
| 2016 | $7,436 | $160,510 | $34,580 | $125,930 |
| 2015 | $7,178 | $176,400 | $37,800 | $138,600 |
| 2014 | $7,035 | $176,400 | $37,800 | $138,600 |
Source: Public Records
Map
Nearby Homes
- 3 Vernon St
- 9 Sanford St
- 229 Homeside Ave
- 1 Rodney St
- 309 Terrace Ave Unit 44
- 12 Collins Dr
- 36 Norfolk St
- 11 Edna St
- 48 Homeside Ave Unit 4
- 49 Glade St Unit A4
- 57 Glade St Unit A1
- 59 Glade St Unit A2
- 15 Crest St Unit 27
- 15 Crest St Unit C15
- 45 Swampscott St
- 108 Rockdale Rd
- 47,47R,63,65R Coleman St
- 70 Coleman St
- 7 Ipswich St
- 161 W Spring St Unit B4
Your Personal Tour Guide
Ask me questions while you tour the home.