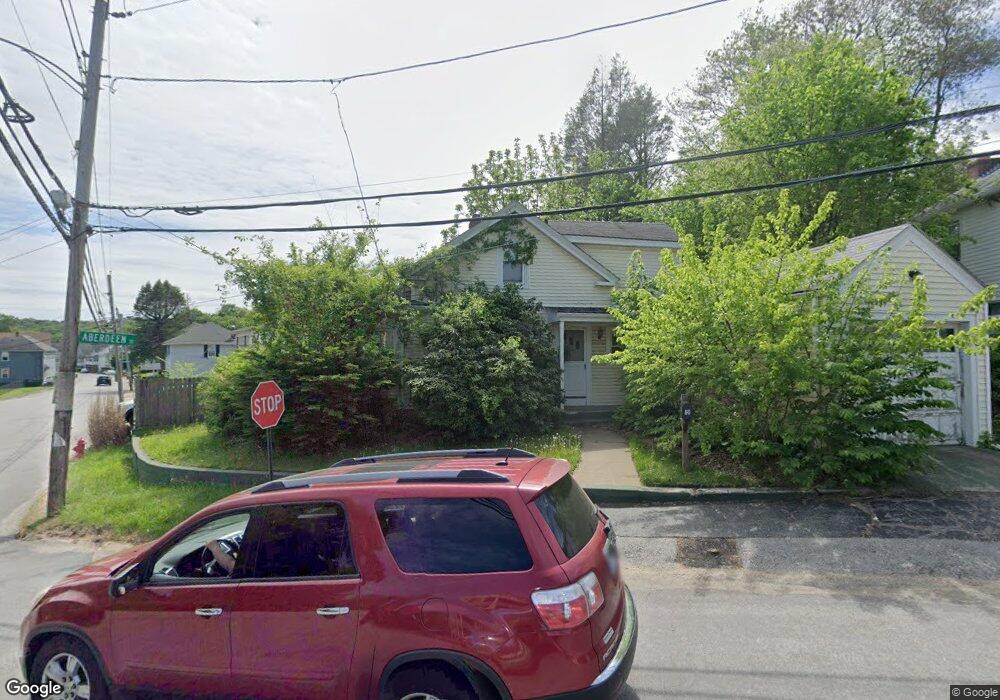
60 Phenix Ave West Warwick, RI 02893
Lippitt-Harris NeighborhoodEstimated Value: $252,000 - $346,000
2
Beds
1
Bath
870
Sq Ft
$357/Sq Ft
Est. Value
About This Home
This home is located at 60 Phenix Ave, West Warwick, RI 02893 and is currently estimated at $310,345, approximately $356 per square foot. 60 Phenix Ave is a home located in Kent County with nearby schools including West Warwick High School, St Joseph School, and Islamic School of Rhode Island.
Ownership History
Date
Name
Owned For
Owner Type
Purchase Details
Closed on
Jan 20, 2011
Sold by
Fhlmc
Bought by
Trott Gary
Current Estimated Value
Purchase Details
Closed on
Jul 26, 2010
Sold by
Gobin Robert J
Bought by
Fhlmc
Purchase Details
Closed on
Jun 23, 2010
Sold by
Govin Robert J
Bought by
Rhode Island Housnig
Purchase Details
Closed on
Jun 3, 2004
Sold by
Es Lancellotta Eleanor
Bought by
Gobin Robert J
Home Financials for this Owner
Home Financials are based on the most recent Mortgage that was taken out on this home.
Original Mortgage
$122,000
Interest Rate
5.94%
Mortgage Type
Purchase Money Mortgage
Create a Home Valuation Report for This Property
The Home Valuation Report is an in-depth analysis detailing your home's value as well as a comparison with similar homes in the area
Home Values in the Area
Average Home Value in this Area
Purchase History
| Date | Buyer | Sale Price | Title Company |
|---|---|---|---|
| Trott Gary | $65,000 | -- | |
| Fhlmc | $110,000 | -- | |
| Rhode Island Housnig | $1,143 | -- | |
| Gobin Robert J | $165,000 | -- |
Source: Public Records
Mortgage History
| Date | Status | Borrower | Loan Amount |
|---|---|---|---|
| Previous Owner | Gobin Robert J | $122,000 |
Source: Public Records
Tax History
| Year | Tax Paid | Tax Assessment Tax Assessment Total Assessment is a certain percentage of the fair market value that is determined by local assessors to be the total taxable value of land and additions on the property. | Land | Improvement |
|---|---|---|---|---|
| 2025 | $3,307 | $231,400 | $67,700 | $163,700 |
| 2024 | $3,736 | $199,900 | $63,900 | $136,000 |
| 2023 | $3,662 | $199,900 | $63,900 | $136,000 |
| 2022 | $3,606 | $199,900 | $63,900 | $136,000 |
| 2021 | $3,287 | $142,900 | $48,900 | $94,000 |
| 2020 | $3,287 | $142,900 | $48,900 | $94,000 |
| 2019 | $4,190 | $142,900 | $48,900 | $94,000 |
| 2018 | $2,892 | $106,400 | $42,100 | $64,300 |
| 2017 | $2,799 | $106,400 | $42,100 | $64,300 |
| 2016 | $2,749 | $106,400 | $42,100 | $64,300 |
| 2015 | $2,695 | $103,800 | $42,100 | $61,700 |
| 2014 | $659 | $103,800 | $42,100 | $61,700 |
Source: Public Records
Map
Nearby Homes
Your Personal Tour Guide
Ask me questions while you tour the home.