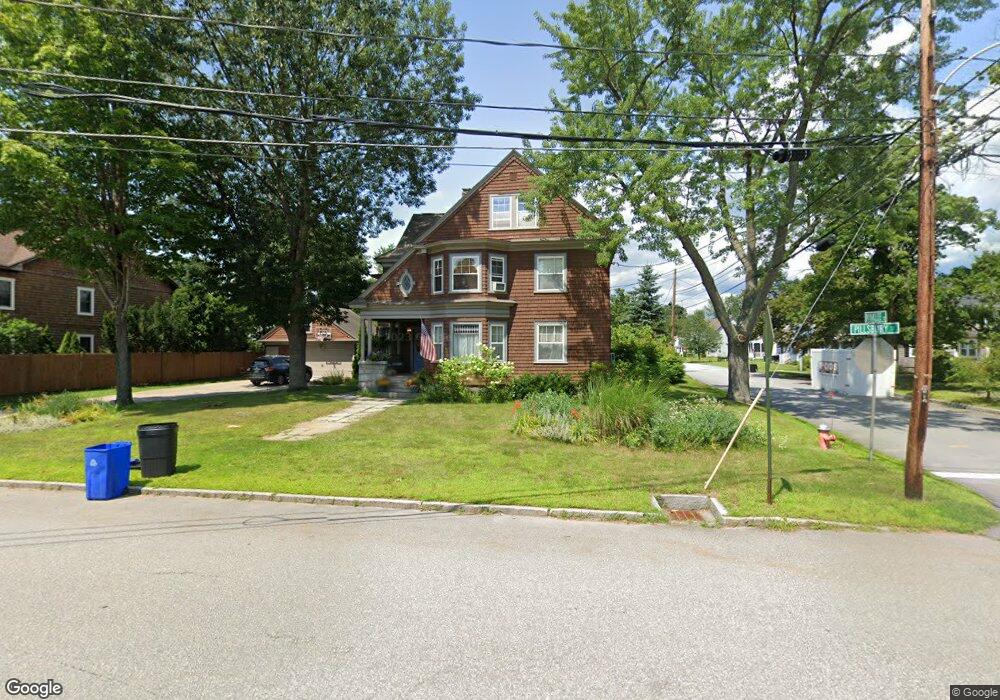
60 Pillsbury St Concord, NH 03301
South End NeighborhoodEstimated Value: $587,000 - $739,000
5
Beds
3
Baths
2,468
Sq Ft
$273/Sq Ft
Est. Value
About This Home
This home is located at 60 Pillsbury St, Concord, NH 03301 and is currently estimated at $672,985, approximately $272 per square foot. 60 Pillsbury St is a home located in Merrimack County with nearby schools including Abbot-Downing School, Rundlett Middle School, and Concord High School.
Ownership History
Date
Name
Owned For
Owner Type
Purchase Details
Closed on
Jun 17, 2008
Sold by
Nielsen Kenneth R and Nielsen Judith C
Bought by
Lothstein Theodore M
Current Estimated Value
Home Financials for this Owner
Home Financials are based on the most recent Mortgage that was taken out on this home.
Original Mortgage
$230,000
Interest Rate
6.13%
Mortgage Type
Purchase Money Mortgage
Create a Home Valuation Report for This Property
The Home Valuation Report is an in-depth analysis detailing your home's value as well as a comparison with similar homes in the area
Home Values in the Area
Average Home Value in this Area
Purchase History
| Date | Buyer | Sale Price | Title Company |
|---|---|---|---|
| Lothstein Theodore M | $330,000 | -- |
Source: Public Records
Mortgage History
| Date | Status | Borrower | Loan Amount |
|---|---|---|---|
| Open | Lothstein Theodore M | $253,600 | |
| Closed | Lothstein Theodore M | $228,211 | |
| Closed | Lothstein Theodore M | $230,000 |
Source: Public Records
Tax History Compared to Growth
Tax History
| Year | Tax Paid | Tax Assessment Tax Assessment Total Assessment is a certain percentage of the fair market value that is determined by local assessors to be the total taxable value of land and additions on the property. | Land | Improvement |
|---|---|---|---|---|
| 2024 | $12,092 | $436,700 | $105,800 | $330,900 |
| 2023 | $11,730 | $436,700 | $105,800 | $330,900 |
| 2022 | $11,306 | $436,700 | $105,800 | $330,900 |
| 2021 | $10,895 | $433,700 | $105,800 | $327,900 |
| 2020 | $10,937 | $408,700 | $88,500 | $320,200 |
| 2019 | $10,659 | $383,700 | $89,200 | $294,500 |
| 2018 | $9,948 | $352,900 | $89,200 | $263,700 |
| 2017 | $9,700 | $343,500 | $87,600 | $255,900 |
| 2016 | $9,079 | $328,100 | $87,600 | $240,500 |
| 2015 | $8,582 | $308,300 | $76,500 | $231,800 |
| 2014 | $8,266 | $308,300 | $76,500 | $231,800 |
| 2013 | -- | $281,100 | $76,500 | $204,600 |
| 2012 | -- | $256,000 | $76,500 | $179,500 |
Source: Public Records
Map
Nearby Homes
- 105 S Main St
- 33 Spruce St
- 0 Spruce St Unit 88
- 122 South St
- 12 Avon St
- 0 South St Unit 4969509
- 24 Pierce St
- 14 Downing St
- 47 South St
- 14-16 Perley St
- 10 Perley St
- 15 Wilson Ave
- 22 Wilson Ave
- 87 S Main St Unit 2
- 376 S Main St
- 4 Fayette St
- 54 Pleasant St Unit 8
- 22 Longmeadow Dr
- 41 Longmeadow Dr
- 7 Highridge Trail