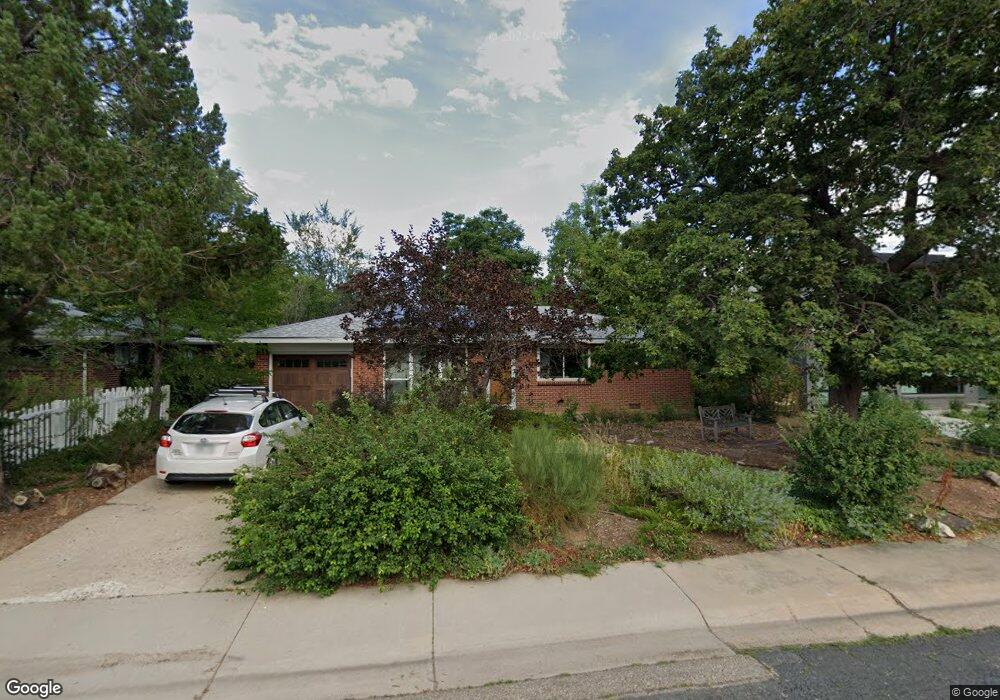
60 S 31st St Boulder, CO 80305
South Boulder NeighborhoodEstimated Value: $766,425 - $823,000
3
Beds
1
Bath
1,026
Sq Ft
$776/Sq Ft
Est. Value
About This Home
This home is located at 60 S 31st St, Boulder, CO 80305 and is currently estimated at $795,856, approximately $775 per square foot. 60 S 31st St is a home located in Boulder County with nearby schools including Creekside Elementary School, Manhattan Middle School of the Arts & Academics, and Fairview High School.
Ownership History
Date
Name
Owned For
Owner Type
Purchase Details
Closed on
Oct 31, 2013
Sold by
Hough Randall D
Bought by
Correll Joshua
Current Estimated Value
Home Financials for this Owner
Home Financials are based on the most recent Mortgage that was taken out on this home.
Original Mortgage
$292,000
Outstanding Balance
$220,578
Interest Rate
4.56%
Mortgage Type
New Conventional
Estimated Equity
$575,278
Purchase Details
Closed on
Jun 26, 2013
Sold by
Hough Randall Dewey
Bought by
Hough Randal Dewey
Create a Home Valuation Report for This Property
The Home Valuation Report is an in-depth analysis detailing your home's value as well as a comparison with similar homes in the area
Home Values in the Area
Average Home Value in this Area
Purchase History
| Date | Buyer | Sale Price | Title Company |
|---|---|---|---|
| Correll Joshua | $365,000 | None Available | |
| Hough Randal Dewey | -- | M & G Title Service Co |
Source: Public Records
Mortgage History
| Date | Status | Borrower | Loan Amount |
|---|---|---|---|
| Open | Correll Joshua | $292,000 |
Source: Public Records
Tax History
| Year | Tax Paid | Tax Assessment Tax Assessment Total Assessment is a certain percentage of the fair market value that is determined by local assessors to be the total taxable value of land and additions on the property. | Land | Improvement |
|---|---|---|---|---|
| 2025 | $4,748 | $50,181 | $29,600 | $20,581 |
| 2024 | $4,748 | $50,181 | $29,600 | $20,581 |
| 2023 | $4,665 | $54,022 | $34,820 | $22,887 |
| 2022 | $4,243 | $45,689 | $26,375 | $19,314 |
| 2021 | $4,046 | $47,004 | $27,134 | $19,870 |
| 2020 | $3,709 | $42,607 | $26,098 | $16,509 |
| 2019 | $3,652 | $42,607 | $26,098 | $16,509 |
| 2018 | $3,357 | $38,722 | $24,048 | $14,674 |
| 2017 | $3,252 | $42,808 | $26,586 | $16,222 |
| 2016 | $3,050 | $35,239 | $16,716 | $18,523 |
| 2015 | $2,889 | $26,729 | $13,691 | $13,038 |
| 2014 | $1,578 | $26,729 | $13,691 | $13,038 |
Source: Public Records
Map
Nearby Homes
- 3000 Dartmouth Ave
- 2955 Stanford Ave
- 2585 Kohler Dr
- 345 S 38th St
- 2795 Vassar Dr
- 3805 Martin Dr
- 210 S 39th St
- 2250 Bluebell Ave
- 2235 Vassar Dr
- 245 Fair Place
- 450 S 41st St
- 2221 Columbine Ave
- 370 20th St
- 805 29th St Unit 253
- 805 29th St Unit 157
- 805 29th St Unit 402
- 805 29th St Unit 404
- 2032 Mariposa Ave
- 1965 Kohler Dr
- 780 33rd St
Your Personal Tour Guide
Ask me questions while you tour the home.