60 Van Buren Unit 282 Irvine, CA 92620
Northwood NeighborhoodEstimated Value: $711,198 - $749,000
2
Beds
2
Baths
903
Sq Ft
$810/Sq Ft
Est. Value
About This Home
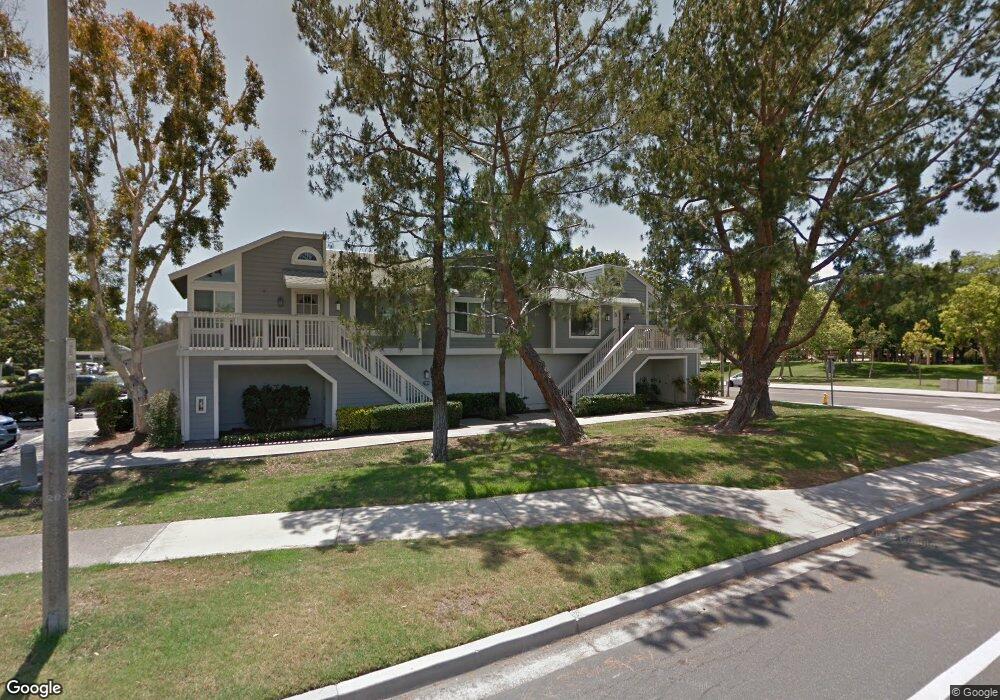
This home is located at 60 Van Buren Unit 282, Irvine, CA 92620 and is currently estimated at $731,550, approximately $810 per square foot. 60 Van Buren Unit 282 is a home located in Orange County with nearby schools including Northwood Elementary School, Sierra Vista Middle School, and Northwood High School.
Ownership History
Date
Name
Owned For
Owner Type
Purchase Details
Closed on
Nov 7, 2019
Sold by
Santos Alberto and Santos Isabel
Bought by
Santos Isabel
Current Estimated Value
Purchase Details
Closed on
May 23, 2001
Sold by
Svoboda Brian Joseph
Bought by
Santos Isabel
Purchase Details
Closed on
May 22, 2001
Sold by
Santos Alberto
Bought by
Santos Isabel
Purchase Details
Closed on
Oct 1, 1998
Sold by
Fox Joseph R
Bought by
Svoboda Brian Joseph
Home Financials for this Owner
Home Financials are based on the most recent Mortgage that was taken out on this home.
Original Mortgage
$136,940
Interest Rate
6.6%
Mortgage Type
FHA
Purchase Details
Closed on
Aug 14, 1997
Sold by
Fox Sandra J and Fox Sandra J
Bought by
Fox Joseph R
Create a Home Valuation Report for This Property
The Home Valuation Report is an in-depth analysis detailing your home's value as well as a comparison with similar homes in the area
Home Values in the Area
Average Home Value in this Area
Purchase History
| Date | Buyer | Sale Price | Title Company |
|---|---|---|---|
| Santos Isabel | -- | None Available | |
| Bracco Julia I | -- | None Available | |
| Santos Isabel | $195,000 | First American Title Ins Co | |
| Santos Isabel | -- | First American Title Ins Co | |
| Svoboda Brian Joseph | $142,000 | Commonwealth Land Title | |
| Fox Joseph R | -- | -- |
Source: Public Records
Mortgage History
| Date | Status | Borrower | Loan Amount |
|---|---|---|---|
| Previous Owner | Svoboda Brian Joseph | $136,940 |
Source: Public Records
Tax History
| Year | Tax Paid | Tax Assessment Tax Assessment Total Assessment is a certain percentage of the fair market value that is determined by local assessors to be the total taxable value of land and additions on the property. | Land | Improvement |
|---|---|---|---|---|
| 2025 | $3,221 | $293,823 | $188,250 | $105,573 |
| 2024 | $3,221 | $288,062 | $184,559 | $103,503 |
| 2023 | $3,138 | $282,414 | $180,940 | $101,474 |
| 2022 | $3,073 | $276,877 | $177,392 | $99,485 |
| 2021 | $3,001 | $271,449 | $173,914 | $97,535 |
| 2020 | $2,984 | $268,666 | $172,131 | $96,535 |
| 2019 | $2,918 | $263,399 | $168,756 | $94,643 |
| 2018 | $2,865 | $258,235 | $165,447 | $92,788 |
| 2017 | $2,806 | $253,172 | $162,203 | $90,969 |
| 2016 | $2,687 | $248,208 | $159,022 | $89,186 |
| 2015 | $2,647 | $244,480 | $156,633 | $87,847 |
| 2014 | $2,597 | $239,691 | $153,564 | $86,127 |
Source: Public Records
Map
Nearby Homes
- 54 Van Buren
- 62 Van Buren Unit 280
- 52 Van Buren Unit 291
- 58 Van Buren Unit 283
- 50 Van Buren Unit 290
- 64 Van Buren Unit 281
- 64 Van Buren
- 48 Van Buren Unit 292
- 48 Van Buren
- 14 Pleasonton
- 16 Pleasonton
- 56 Van Buren Unit 285
- 36 Van Buren
- 56 Van Buren
- 46 Van Buren Unit 293
- 18 Pleasonton
- 95 Remington Unit 218
- 44 Van Buren Unit 286
- 12 Pleasonton
- 20 Pleasonton