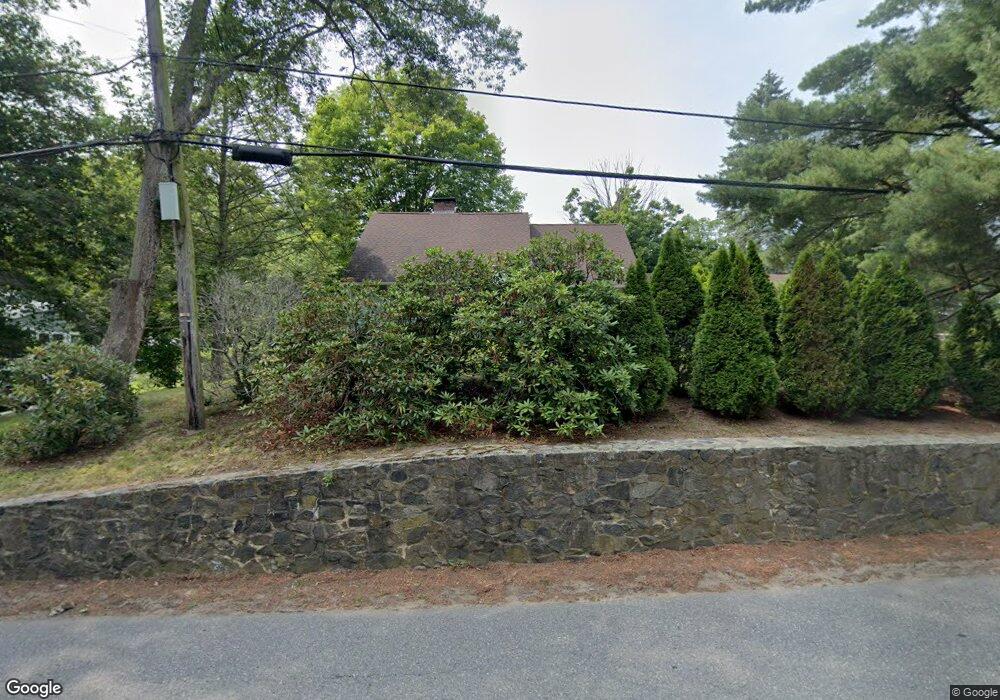
60 Wenham St Danvers, MA 01923
Estimated Value: $750,000 - $881,000
4
Beds
2
Baths
2,538
Sq Ft
$324/Sq Ft
Est. Value
About This Home
This home is located at 60 Wenham St, Danvers, MA 01923 and is currently estimated at $821,508, approximately $323 per square foot. 60 Wenham St is a home located in Essex County with nearby schools including Danvers High School, St. Mary of the Annunciation School, and St. John's Prep.
Ownership History
Date
Name
Owned For
Owner Type
Purchase Details
Closed on
Jul 10, 1998
Sold by
Walsh Dennis Joseph and Foye-Walsh Karen
Bought by
Labonte-Britt Linda and Britt Michael K
Current Estimated Value
Home Financials for this Owner
Home Financials are based on the most recent Mortgage that was taken out on this home.
Original Mortgage
$192,000
Interest Rate
7.02%
Mortgage Type
Purchase Money Mortgage
Create a Home Valuation Report for This Property
The Home Valuation Report is an in-depth analysis detailing your home's value as well as a comparison with similar homes in the area
Home Values in the Area
Average Home Value in this Area
Purchase History
| Date | Buyer | Sale Price | Title Company |
|---|---|---|---|
| Labonte-Britt Linda | $240,000 | -- |
Source: Public Records
Mortgage History
| Date | Status | Borrower | Loan Amount |
|---|---|---|---|
| Open | Labonte-Britt Linda | $250,000 | |
| Closed | Labonte-Britt Linda | $50,000 | |
| Closed | Labonte-Britt Linda | $192,000 |
Source: Public Records
Tax History
| Year | Tax Paid | Tax Assessment Tax Assessment Total Assessment is a certain percentage of the fair market value that is determined by local assessors to be the total taxable value of land and additions on the property. | Land | Improvement |
|---|---|---|---|---|
| 2025 | $7,414 | $674,600 | $397,600 | $277,000 |
| 2024 | $7,334 | $660,100 | $397,600 | $262,500 |
| 2023 | $6,922 | $589,100 | $352,600 | $236,500 |
| 2022 | $6,764 | $534,300 | $307,600 | $226,700 |
| 2021 | $6,359 | $476,300 | $279,100 | $197,200 |
| 2020 | $5,945 | $455,200 | $270,100 | $185,100 |
| 2019 | $5,884 | $443,100 | $261,100 | $182,000 |
| 2018 | $5,658 | $417,900 | $253,600 | $164,300 |
| 2017 | $5,545 | $390,800 | $235,600 | $155,200 |
| 2016 | $5,335 | $375,700 | $225,100 | $150,600 |
| 2015 | $5,119 | $343,300 | $195,100 | $148,200 |
Source: Public Records
Map
Nearby Homes
Your Personal Tour Guide
Ask me questions while you tour the home.