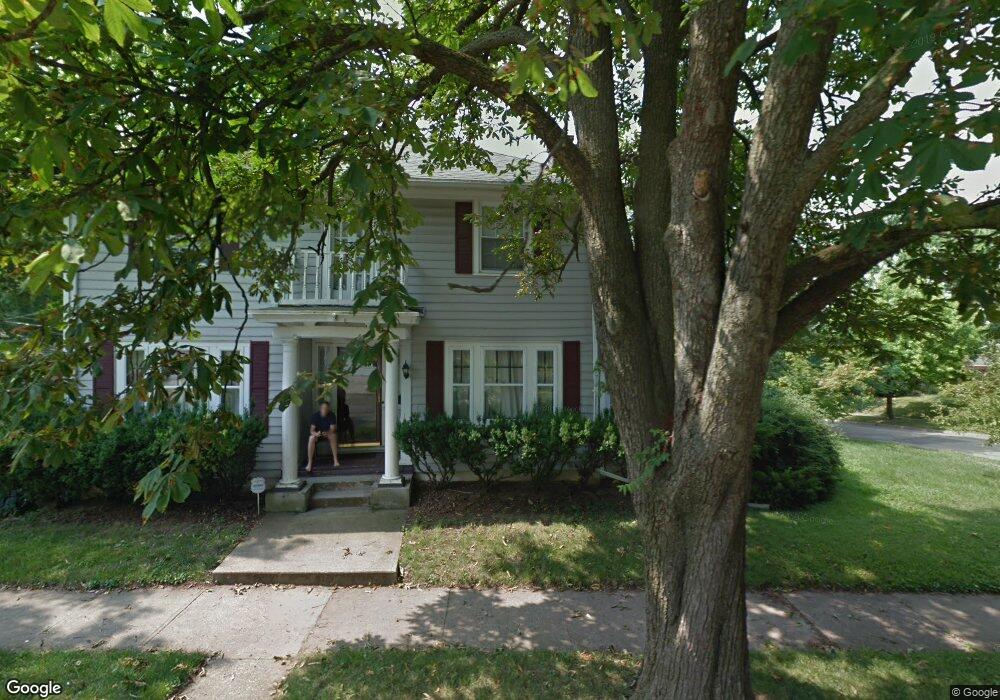
600 Elberon Ave Dayton, OH 45403
Eastern Hills NeighborhoodEstimated Value: $155,000 - $179,957
4
Beds
2
Baths
1,964
Sq Ft
$85/Sq Ft
Est. Value
About This Home
This home is located at 600 Elberon Ave, Dayton, OH 45403 and is currently estimated at $166,489, approximately $84 per square foot. 600 Elberon Ave is a home located in Montgomery County with nearby schools including Ruskin Elementary School, Kiser Elementary, and Horizon Science Academy Dayton Downtown.
Ownership History
Date
Name
Owned For
Owner Type
Purchase Details
Closed on
May 24, 2017
Sold by
Austin Gillman
Bought by
Mitchell Stanley and Mitchell Sandra
Current Estimated Value
Home Financials for this Owner
Home Financials are based on the most recent Mortgage that was taken out on this home.
Original Mortgage
$84,096
Outstanding Balance
$69,274
Interest Rate
4.02%
Estimated Equity
$97,215
Purchase Details
Closed on
May 23, 2017
Sold by
Gilman Austin
Bought by
Stanley Mitchell
Home Financials for this Owner
Home Financials are based on the most recent Mortgage that was taken out on this home.
Original Mortgage
$84,096
Outstanding Balance
$69,274
Interest Rate
4.02%
Estimated Equity
$97,215
Purchase Details
Closed on
Sep 30, 2004
Sold by
Suhr Rob Alan and Suhr Jacquelyn Jeanne
Bought by
Gilman Austin
Home Financials for this Owner
Home Financials are based on the most recent Mortgage that was taken out on this home.
Original Mortgage
$108,800
Interest Rate
5.12%
Mortgage Type
Fannie Mae Freddie Mac
Purchase Details
Closed on
Feb 24, 1995
Sold by
Merchant Paul and Merchant Grace T
Bought by
Metcalf J B and Metcalf Tammy J
Create a Home Valuation Report for This Property
The Home Valuation Report is an in-depth analysis detailing your home's value as well as a comparison with similar homes in the area
Home Values in the Area
Average Home Value in this Area
Purchase History
| Date | Buyer | Sale Price | Title Company |
|---|---|---|---|
| Mitchell Stanley | -- | -- | |
| Stanley Mitchell | $87,000 | -- | |
| Gilman Austin | $108,800 | None Available | |
| Metcalf J B | -- | -- |
Source: Public Records
Mortgage History
| Date | Status | Borrower | Loan Amount |
|---|---|---|---|
| Open | Stanley Mitchell | $84,096 | |
| Closed | Stanley Mitchell | -- | |
| Closed | Stanley Mitchell | -- | |
| Previous Owner | Gilman Austin | $108,800 |
Source: Public Records
Tax History
| Year | Tax Paid | Tax Assessment Tax Assessment Total Assessment is a certain percentage of the fair market value that is determined by local assessors to be the total taxable value of land and additions on the property. | Land | Improvement |
|---|---|---|---|---|
| 2025 | $2,257 | $39,180 | $5,030 | $34,150 |
| 2024 | $2,197 | $39,180 | $5,030 | $34,150 |
| 2023 | $2,197 | $39,180 | $5,030 | $34,150 |
| 2022 | $2,116 | $29,170 | $3,750 | $25,420 |
| 2021 | $2,105 | $29,170 | $3,750 | $25,420 |
| 2020 | $2,100 | $29,170 | $3,750 | $25,420 |
| 2019 | $1,891 | $23,570 | $3,750 | $19,820 |
| 2018 | $1,893 | $23,570 | $3,750 | $19,820 |
| 2017 | $1,878 | $23,570 | $3,750 | $19,820 |
| 2016 | $2,014 | $24,080 | $3,750 | $20,330 |
| 2015 | $1,905 | $24,080 | $3,750 | $20,330 |
| 2014 | $1,905 | $24,080 | $3,750 | $20,330 |
| 2012 | -- | $26,200 | $5,820 | $20,380 |
Source: Public Records
Map
Nearby Homes
- 715 Gondert Ave
- 1340 Huffman Ave
- 806 Gondert Ave
- 1323 Huffman Ave
- 760 Greenlawn Ave
- 20 Parnell Ave
- 816 S Smithville Rd
- 1620 Gondert Ave Unit 1618
- 1620 Gondert Ave
- 1345 Jordan Ave
- 1669 Tuttle Ave
- 503 Sheridan Ave
- 115 Oaklawn Ave
- 321 S Harbine Ave
- 159 Oaklawn Ave
- 1764 Gummer Ave
- 1080 Linden Ave
- 453 Livingston Ave
- 1116 Linden Ave
- 812 Kester Ave
- 606 Elberon Ave
- 610 Elberon Ave
- 560 Elberon Ave
- 545 Gondert Ave
- 612 Elberon Ave
- 601 Gondert Ave
- 1418 Gummer Ave
- 607 Gondert Ave
- 556 Elberon Ave
- 618 Elberon Ave
- 539 Gondert Ave
- 1414 Gummer Ave
- 611 Gondert Ave
- 615 Elberon Ave
- 622 Elberon Ave
- 550 Elberon Ave
- 1408 Gummer Ave
- 546 Gondert Ave
- 615 Gondert Ave
- 624 Elberon Ave
Your Personal Tour Guide
Ask me questions while you tour the home.