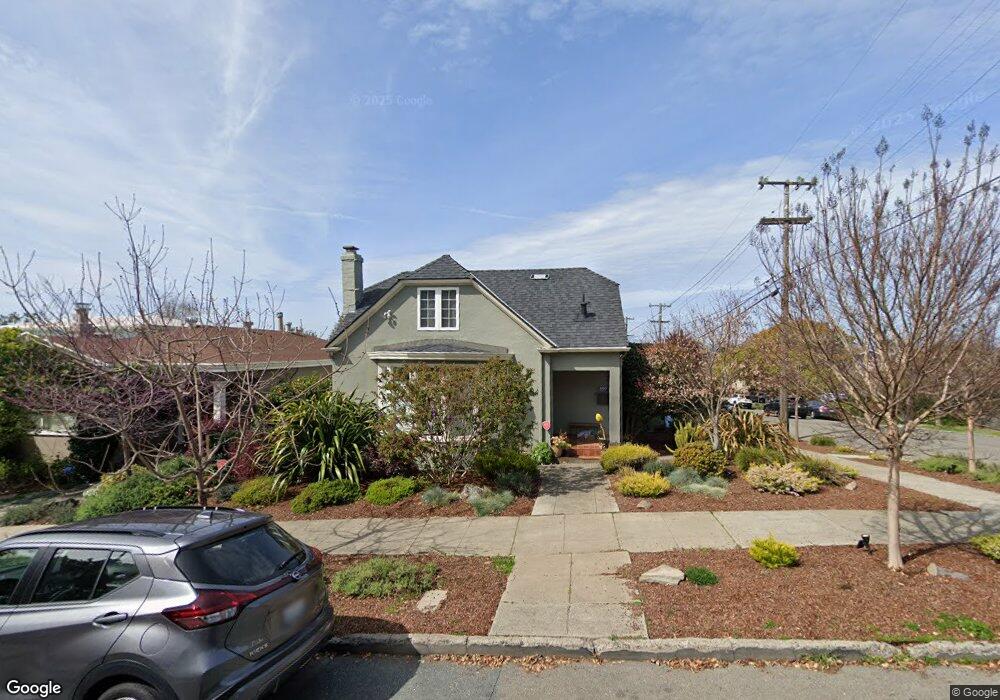
600 Peralta Ave Berkeley, CA 94707
Thousand Oaks NeighborhoodEstimated Value: $1,661,000 - $2,012,000
4
Beds
2
Baths
1,724
Sq Ft
$1,062/Sq Ft
Est. Value
About This Home
This home is located at 600 Peralta Ave, Berkeley, CA 94707 and is currently estimated at $1,831,043, approximately $1,062 per square foot. 600 Peralta Ave is a home located in Alameda County with nearby schools including Thousand Oaks Elementary School, Ruth Acty Elementary, and Berkeley Arts Magnet at Whittier School.
Ownership History
Date
Name
Owned For
Owner Type
Purchase Details
Closed on
Mar 26, 2024
Sold by
Miller Charles Robert and Loungway Deirdre A
Bought by
Miller Loungway Family Trust and Miller
Current Estimated Value
Purchase Details
Closed on
Jun 3, 2005
Sold by
Reiydelle Daemeon and Reiydelle Billie H
Bought by
Miller Charles Robert and Loungway Deirdre A
Home Financials for this Owner
Home Financials are based on the most recent Mortgage that was taken out on this home.
Original Mortgage
$740,000
Interest Rate
5.25%
Mortgage Type
Purchase Money Mortgage
Create a Home Valuation Report for This Property
The Home Valuation Report is an in-depth analysis detailing your home's value as well as a comparison with similar homes in the area
Home Values in the Area
Average Home Value in this Area
Purchase History
| Date | Buyer | Sale Price | Title Company |
|---|---|---|---|
| Miller Loungway Family Trust | -- | None Listed On Document | |
| Miller Charles Robert | $925,000 | Chicago Title Co |
Source: Public Records
Mortgage History
| Date | Status | Borrower | Loan Amount |
|---|---|---|---|
| Previous Owner | Miller Charles Robert | $740,000 | |
| Closed | Miller Charles Robert | $92,500 |
Source: Public Records
Tax History
| Year | Tax Paid | Tax Assessment Tax Assessment Total Assessment is a certain percentage of the fair market value that is determined by local assessors to be the total taxable value of land and additions on the property. | Land | Improvement |
|---|---|---|---|---|
| 2025 | $17,896 | $1,293,181 | $386,773 | $913,408 |
| 2024 | $17,896 | $1,267,696 | $379,192 | $895,504 |
| 2023 | $17,546 | $1,242,706 | $371,758 | $877,948 |
| 2022 | $17,279 | $1,218,209 | $364,471 | $860,738 |
| 2021 | $17,351 | $1,194,188 | $357,325 | $843,863 |
| 2020 | $16,538 | $1,188,874 | $353,662 | $835,212 |
| 2019 | $15,897 | $1,155,768 | $346,730 | $809,038 |
| 2018 | $15,660 | $1,133,115 | $339,934 | $793,181 |
| 2017 | $15,127 | $1,110,905 | $333,271 | $777,634 |
| 2016 | $14,730 | $1,089,131 | $326,739 | $762,392 |
| 2015 | $14,548 | $1,072,777 | $321,833 | $750,944 |
| 2014 | $13,088 | $940,000 | $282,000 | $658,000 |
Source: Public Records
Map
Nearby Homes
- 753 Peralta Ave
- 731 Santa fe Ave
- 415 Berkeley Park Blvd
- 491 Vincente Ave
- 1858 San Lorenzo Ave
- 118 Ramona Ave
- 145 Ramona Ave
- 1266 Washington Ave
- 840 Key Route Blvd
- 712 Masonic Ave
- 1236 Portland Ave
- 1498 Sonoma Ave
- 1983 Yosemite Rd
- 417 Evelyn Ave Unit 205
- 589 San Luis Rd
- 1036 Ramona Ave
- 1741 Sonoma Ave
- 848 Stannage Ave Unit 11
- 305 Coronado St
- 765 San Diego Rd
- 608 Peralta Ave
- 605 Neilson St
- 613 Neilson St
- 620 Peralta Ave
- 600 Colusa Ave
- 619 Neilson St
- 1581 Thousand Oaks Blvd
- 1599 Thousand Oaks Blvd
- 1573 Thousand Oaks Blvd
- 604 Colusa Ave
- 625 Neilson St
- 626 Peralta Ave
- 1559 Thousand Oaks Blvd
- 633 Neilson St
- 574 Peralta Ave
- 579 Neilson St
- 599 Colusa Ave
- 638 Peralta Ave
- 610 Colusa Ave
- 641 Neilson St
Your Personal Tour Guide
Ask me questions while you tour the home.