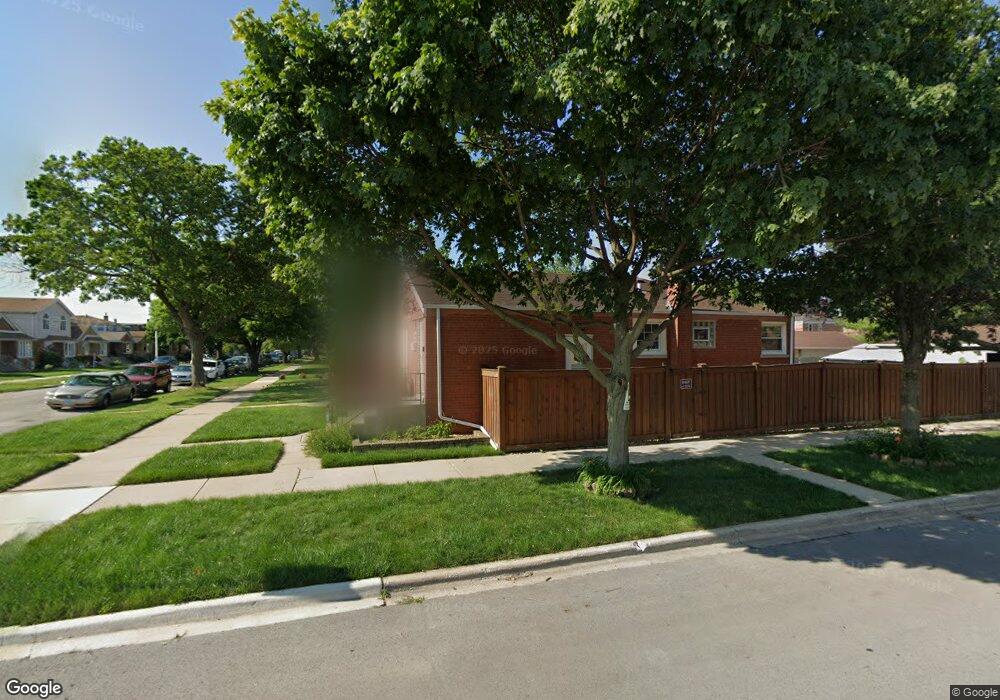
6004 S Mcvicker Ave Chicago, IL 60638
Clearing NeighborhoodEstimated Value: $342,000 - $440,000
3
Beds
2
Baths
960
Sq Ft
$383/Sq Ft
Est. Value
About This Home
This home is located at 6004 S Mcvicker Ave, Chicago, IL 60638 and is currently estimated at $367,308, approximately $382 per square foot. 6004 S Mcvicker Ave is a home located in Cook County with nearby schools including Hale Elementary School, Kennedy High School, and St. Symphorosa Catholic School.
Ownership History
Date
Name
Owned For
Owner Type
Purchase Details
Closed on
Sep 20, 2017
Sold by
Ontiveros Johnny F and Vicenteno Michelle
Bought by
Garrity Gina M
Current Estimated Value
Home Financials for this Owner
Home Financials are based on the most recent Mortgage that was taken out on this home.
Original Mortgage
$195,200
Outstanding Balance
$163,398
Interest Rate
3.99%
Mortgage Type
New Conventional
Estimated Equity
$203,910
Purchase Details
Closed on
Jan 23, 2004
Sold by
Belak Scott and Belak Michelle
Bought by
Ontiveros Johnny F and Vicenteno Michelle
Purchase Details
Closed on
Mar 21, 1995
Sold by
Pucka Chester S and Pucka Estelle L
Bought by
Belak Scott and Belak Steven
Home Financials for this Owner
Home Financials are based on the most recent Mortgage that was taken out on this home.
Original Mortgage
$81,000
Interest Rate
8.26%
Create a Home Valuation Report for This Property
The Home Valuation Report is an in-depth analysis detailing your home's value as well as a comparison with similar homes in the area
Home Values in the Area
Average Home Value in this Area
Purchase History
| Date | Buyer | Sale Price | Title Company |
|---|---|---|---|
| Garrity Gina M | $244,000 | Attorney | |
| Ontiveros Johnny F | $218,000 | Ticor Title Insurance | |
| Belak Scott | $121,000 | Ticor Title Insurance |
Source: Public Records
Mortgage History
| Date | Status | Borrower | Loan Amount |
|---|---|---|---|
| Open | Garrity Gina M | $195,200 | |
| Previous Owner | Belak Scott | $81,000 |
Source: Public Records
Tax History Compared to Growth
Tax History
| Year | Tax Paid | Tax Assessment Tax Assessment Total Assessment is a certain percentage of the fair market value that is determined by local assessors to be the total taxable value of land and additions on the property. | Land | Improvement |
|---|---|---|---|---|
| 2024 | $3,964 | $26,000 | $5,250 | $20,750 |
| 2023 | $3,843 | $22,001 | $4,688 | $17,313 |
| 2022 | $3,843 | $22,001 | $4,688 | $17,313 |
| 2021 | $4,424 | $21,999 | $4,687 | $17,312 |
| 2020 | $3,985 | $17,774 | $3,750 | $14,024 |
| 2019 | $3,993 | $19,749 | $3,750 | $15,999 |
| 2018 | $3,926 | $19,749 | $3,750 | $15,999 |
| 2017 | $2,760 | $16,110 | $3,375 | $12,735 |
| 2016 | $2,744 | $16,110 | $3,375 | $12,735 |
| 2015 | $2,489 | $16,110 | $3,375 | $12,735 |
| 2014 | $2,445 | $15,647 | $3,187 | $12,460 |
| 2013 | $2,387 | $15,647 | $3,187 | $12,460 |
Source: Public Records
Map
Nearby Homes
- 6004 S Moody Ave
- 5914 S Meade Ave
- 6037 S Mason Ave
- 6158 W 60th St Unit 10
- 6016 S Mayfield Ave
- 6122 W 59th St
- 6046 S Melvina Ave
- 5917 W 59th St
- 6152 S Austin Ave
- 6201 S Meade Ave
- 6204 S Mcvicker Ave
- 5810 S Austin Ave
- 6220 S Mcvicker Ave
- 6109 S Monitor Ave
- 6005 S Menard Ave
- 5727 S Meade Ave
- 7754 S Mcvicker Ave
- 6252 S Mason Ave Unit 3B
- 6154 W 63rd St Unit 3W
- 6111 S Menard Ave
- 6006 S Mcvicker Ave
- 6000 S Mcvicker Ave
- 6010 S Mcvicker Ave
- 6012 S Mcvicker Ave
- 6016 S Mcvicker Ave
- 6007 S Meade Ave
- 6003 S Meade Ave
- 6018 S Mcvicker Ave
- 6011 S Meade Ave
- 6038 W 60th St
- 6001 S Meade Ave
- 6034 W 60th St
- 6015 S Meade Ave
- 6022 N Mcvicker Ave
- 6022 S Mcvicker Ave
- 6005 S Mcvicker Ave
- 6007 S Mcvicker Ave
- 6001 S Mcvicker Ave
- 6042 W 60th St
- 6019 S Meade Ave