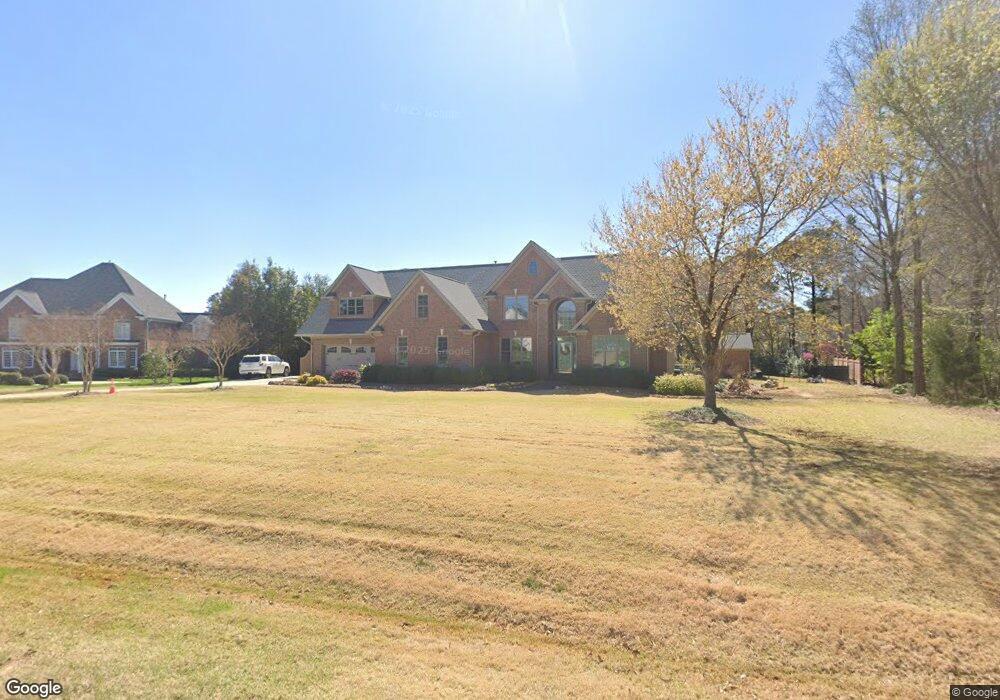
6005 Atkins Farm Ct Raleigh, NC 27606
Middle Creek NeighborhoodEstimated Value: $859,000 - $1,085,000
4
Beds
4
Baths
2,968
Sq Ft
$330/Sq Ft
Est. Value
About This Home
This home is located at 6005 Atkins Farm Ct, Raleigh, NC 27606 and is currently estimated at $979,757, approximately $330 per square foot. 6005 Atkins Farm Ct is a home located in Wake County with nearby schools including Swift Creek Elementary School, Dillard Drive Magnet Middle School, and Resurrection Lutheran School.
Ownership History
Date
Name
Owned For
Owner Type
Purchase Details
Closed on
Oct 27, 2016
Sold by
Kim Kyung Jum and Kim Hyeri
Bought by
Waite Michael R and Waite Alcia A
Current Estimated Value
Home Financials for this Owner
Home Financials are based on the most recent Mortgage that was taken out on this home.
Original Mortgage
$352,000
Outstanding Balance
$282,595
Interest Rate
3.42%
Mortgage Type
New Conventional
Estimated Equity
$697,162
Purchase Details
Closed on
Jan 21, 2000
Sold by
Moore Richard O
Bought by
Kim Kyung Jun and Kim Hyeri
Home Financials for this Owner
Home Financials are based on the most recent Mortgage that was taken out on this home.
Original Mortgage
$245,000
Interest Rate
7.9%
Purchase Details
Closed on
Aug 3, 1998
Sold by
Keith M Flinchum Builder Inc
Bought by
Moore Richard O and Moore Elaine K
Home Financials for this Owner
Home Financials are based on the most recent Mortgage that was taken out on this home.
Original Mortgage
$113,900
Interest Rate
6.96%
Create a Home Valuation Report for This Property
The Home Valuation Report is an in-depth analysis detailing your home's value as well as a comparison with similar homes in the area
Home Values in the Area
Average Home Value in this Area
Purchase History
| Date | Buyer | Sale Price | Title Company |
|---|---|---|---|
| Waite Michael R | $440,000 | None Available | |
| Kim Kyung Jun | $338,000 | -- | |
| Moore Richard O | $349,000 | -- |
Source: Public Records
Mortgage History
| Date | Status | Borrower | Loan Amount |
|---|---|---|---|
| Open | Waite Michael R | $352,000 | |
| Previous Owner | Kim Kyung Jun | $245,000 | |
| Previous Owner | Moore Richard O | $113,900 |
Source: Public Records
Tax History Compared to Growth
Tax History
| Year | Tax Paid | Tax Assessment Tax Assessment Total Assessment is a certain percentage of the fair market value that is determined by local assessors to be the total taxable value of land and additions on the property. | Land | Improvement |
|---|---|---|---|---|
| 2025 | $6,210 | $967,823 | $240,000 | $727,823 |
| 2024 | $6,030 | $967,823 | $240,000 | $727,823 |
| 2023 | $4,596 | $586,864 | $115,200 | $471,664 |
| 2022 | $4,258 | $586,864 | $115,200 | $471,664 |
| 2021 | $4,081 | $577,984 | $115,200 | $462,784 |
| 2020 | $3,673 | $528,583 | $115,200 | $413,383 |
| 2019 | $3,650 | $444,441 | $121,500 | $322,941 |
| 2018 | $3,355 | $444,441 | $121,500 | $322,941 |
| 2017 | $3,180 | $444,441 | $121,500 | $322,941 |
| 2016 | $3,116 | $444,441 | $121,500 | $322,941 |
| 2015 | $3,125 | $447,148 | $110,000 | $337,148 |
| 2014 | $2,962 | $447,148 | $110,000 | $337,148 |
Source: Public Records
Map
Nearby Homes
- 6001 Atkins Farm Ct
- 3120 White Dove Ct
- 9004 Penny Rd
- 2517 High Ridge Dr
- 2721 Glassman Ln
- 3417 Birk Bluff Ct
- 5317 Deep Valley
- 106 Birkhaven Dr
- 5300 Deep Valley
- 6508 Deerview Dr
- 8014 Penny Rd
- 8016 Penny Rd
- 8012 Penny Rd
- 740 Loch Highlands Dr
- 114 Birklands Dr
- 3013 Ivory Bluff Trail
- 113 Barcliff Terrace
- 5308 Amsterdam Place
- 103 Glenbrae Ct
- 6002 Churchill Falls Place
- LOT 5 Watkins Farm
- 6009 Atkins Farm Ct
- 6016 Tenbury Ct
- 6012 Tenbury Ct
- 6008 Atkins Farm Ct
- 6000 Atkins Farm Ct
- 6100 Heatherstone Dr
- 6004 Atkins Farm Ct
- 6000 Tenbury Ct
- 6212 Heatherstone Dr
- 6105 Heatherstone Dr
- 6201 Heatherstone Dr
- 6101 Heatherstone Dr
- 6216 Heatherstone Dr
- 6017 Tenbury Ct
- 6033 Heatherstone Dr
- 6021 Tenbury Ct
- 6205 Heatherstone Dr
- 2521 Pennyshire Ln
- 6209 Heatherstone Dr