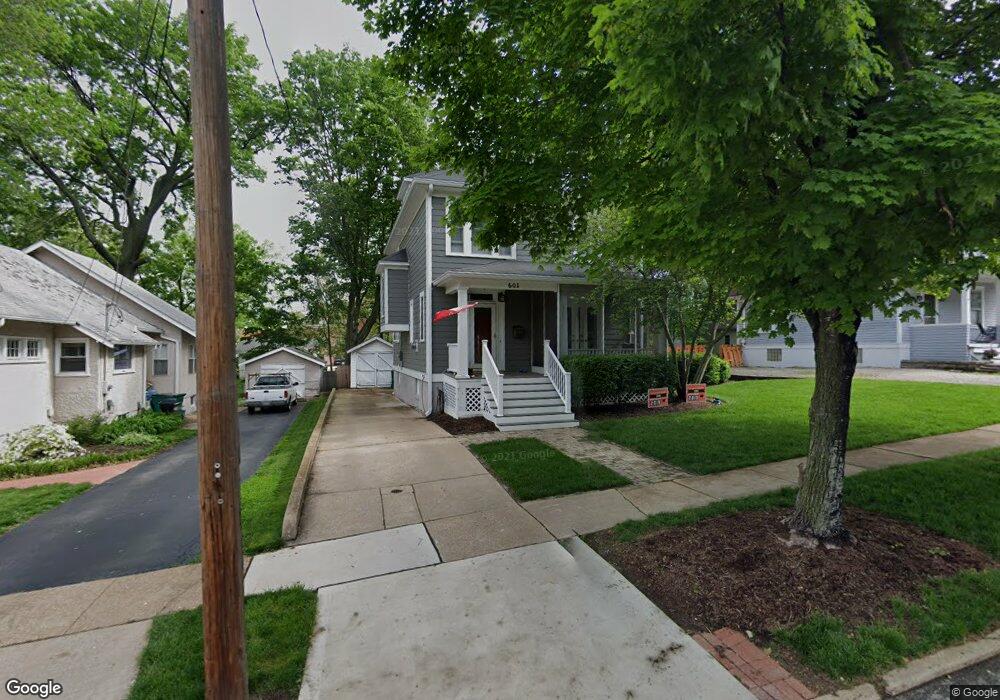
601 Clark Ave Saint Louis, MO 63119
Estimated Value: $421,000 - $657,000
4
Beds
1
Bath
1,731
Sq Ft
$283/Sq Ft
Est. Value
About This Home
This home is located at 601 Clark Ave, Saint Louis, MO 63119 and is currently estimated at $489,480, approximately $282 per square foot. 601 Clark Ave is a home located in St. Louis County with nearby schools including Avery Elementary School, Hixson Middle School, and Webster Groves High School.
Ownership History
Date
Name
Owned For
Owner Type
Purchase Details
Closed on
May 21, 2020
Sold by
Sellers Robert W and Sellers Kirsten
Bought by
Sellers Robert W and Sellers Kirsten
Current Estimated Value
Purchase Details
Closed on
Apr 6, 2001
Sold by
Robert Sellers
Bought by
Sellers Robert W and Sellers Kirsten
Purchase Details
Closed on
Feb 2, 2001
Sold by
Robert Sellers
Bought by
Sellers Kirsten and Sellers Robert W
Purchase Details
Closed on
May 2, 2000
Sold by
Robert Sellers
Bought by
Sellers Robert W and Sellers Kirsten
Purchase Details
Closed on
Jan 11, 1999
Sold by
Gibbons Michael K and Gibbons Karen E
Bought by
Sellers Robert and Sellers Kirsten
Home Financials for this Owner
Home Financials are based on the most recent Mortgage that was taken out on this home.
Original Mortgage
$199,500
Outstanding Balance
$45,875
Interest Rate
6.66%
Estimated Equity
$443,605
Purchase Details
Closed on
Jul 27, 1998
Sold by
Gaidis Timothy J and Gaidis Julie A
Bought by
Gibbons Michael K and Gibbons Karen E
Home Financials for this Owner
Home Financials are based on the most recent Mortgage that was taken out on this home.
Original Mortgage
$163,200
Interest Rate
6.94%
Create a Home Valuation Report for This Property
The Home Valuation Report is an in-depth analysis detailing your home's value as well as a comparison with similar homes in the area
Home Values in the Area
Average Home Value in this Area
Purchase History
| Date | Buyer | Sale Price | Title Company |
|---|---|---|---|
| Sellers Robert W | -- | None Available | |
| Sellers Robert W | -- | -- | |
| Sellers Kirsten | -- | -- | |
| Sellers Robert W | -- | -- | |
| Sellers Robert | $210,000 | -- | |
| Gibbons Michael K | -- | -- |
Source: Public Records
Mortgage History
| Date | Status | Borrower | Loan Amount |
|---|---|---|---|
| Open | Sellers Robert | $199,500 | |
| Previous Owner | Gibbons Michael K | $163,200 |
Source: Public Records
Tax History Compared to Growth
Tax History
| Year | Tax Paid | Tax Assessment Tax Assessment Total Assessment is a certain percentage of the fair market value that is determined by local assessors to be the total taxable value of land and additions on the property. | Land | Improvement |
|---|---|---|---|---|
| 2025 | $4,519 | $67,450 | $41,590 | $25,860 |
| 2024 | $4,519 | $64,830 | $30,250 | $34,580 |
| 2023 | $4,497 | $64,830 | $30,250 | $34,580 |
| 2022 | $4,206 | $56,280 | $30,250 | $26,030 |
| 2021 | $4,192 | $56,280 | $30,250 | $26,030 |
| 2020 | $3,757 | $46,930 | $30,250 | $16,680 |
| 2019 | $3,731 | $46,930 | $30,250 | $16,680 |
| 2018 | $3,862 | $43,170 | $21,190 | $21,980 |
| 2017 | $3,836 | $43,170 | $21,190 | $21,980 |
| 2016 | $3,780 | $40,740 | $18,150 | $22,590 |
| 2015 | $3,794 | $40,740 | $18,150 | $22,590 |
| 2014 | $4,574 | $47,850 | $13,020 | $34,830 |
Source: Public Records
Map
Nearby Homes
- 610 Cornelia Ave
- 619 N Bompart Ave
- 716 Clark Ave
- 441 Park Rd
- 544 Summit Ave
- 808 Greeley Ave
- 400 Marion Ave
- 840 Marshall Ave
- 835 N Forest Ave
- 814 Holland Ave
- 2911 Brazeau Ave
- 2905 Brazeau Ave
- 546 Holland Ave
- 2829 Brazeau Ave
- 946 Marshall Ave Unit D
- 827 Cornell Ave
- 112 Oakwood Ave
- 2904 Collier Ave
- 940 Brookside Ave
- 8908 W Pendleton Ave
- 537 Clark Ave
- 607 Clark Ave
- 535 Clark Ave
- 615 Clark Ave
- 600 Atalanta Ave
- 536 Atalanta Ave
- 529 Clark Ave
- 608 Atalanta Ave
- 534 Atalanta Ave
- 617 Clark Ave
- 538 Clark Ave
- 602 Clark Ave
- 525 Clark Ave
- 534 Clark Ave
- 532 Atalanta Ave
- 532 Clark Ave
- 823 N Bompart Ave
- 604 Clark Ave
- 819 N Bompart Ave
- 621 Clark Ave