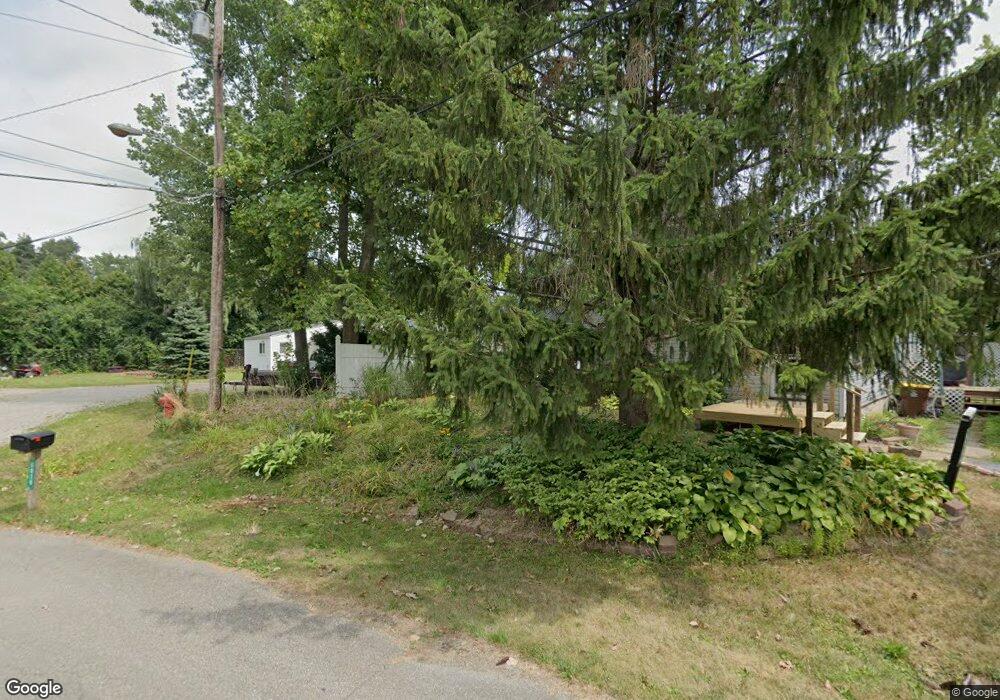
6010 Cypress St Haslett, MI 48840
Estimated Value: $153,000 - $185,000
3
Beds
1
Bath
1,024
Sq Ft
$170/Sq Ft
Est. Value
About This Home
This home is located at 6010 Cypress St, Haslett, MI 48840 and is currently estimated at $173,768, approximately $169 per square foot. 6010 Cypress St is a home located in Ingham County with nearby schools including Haslett High School, St Thomas Aquinas School, and St. Martha School.
Ownership History
Date
Name
Owned For
Owner Type
Purchase Details
Closed on
Dec 23, 2009
Sold by
Denby Brandon S
Bought by
Baker Maurice
Current Estimated Value
Home Financials for this Owner
Home Financials are based on the most recent Mortgage that was taken out on this home.
Original Mortgage
$56,458
Outstanding Balance
$36,712
Interest Rate
4.84%
Mortgage Type
FHA
Estimated Equity
$137,056
Purchase Details
Closed on
Jul 8, 2009
Sold by
Prater Shawna C
Bought by
Denby Brandon S and Prater Revocable Living Trust
Purchase Details
Closed on
Jan 8, 2009
Sold by
Prater Shawna C
Bought by
Lasalle Bank National Association
Purchase Details
Closed on
Jun 4, 2003
Sold by
Matthews Loren A and Matthews Loren Arthur
Bought by
Prater Shawna C
Home Financials for this Owner
Home Financials are based on the most recent Mortgage that was taken out on this home.
Original Mortgage
$80,750
Interest Rate
5.4%
Mortgage Type
Purchase Money Mortgage
Create a Home Valuation Report for This Property
The Home Valuation Report is an in-depth analysis detailing your home's value as well as a comparison with similar homes in the area
Home Values in the Area
Average Home Value in this Area
Purchase History
| Date | Buyer | Sale Price | Title Company |
|---|---|---|---|
| Baker Maurice | $57,500 | Chicago Title | |
| Baker Maurice | -- | Chicago Title | |
| Denby Brandon S | -- | None Available | |
| Lasalle Bank National Association | $85,000 | None Available | |
| Prater Shawna C | $85,000 | Trans |
Source: Public Records
Mortgage History
| Date | Status | Borrower | Loan Amount |
|---|---|---|---|
| Open | Baker Maurice | $56,458 | |
| Previous Owner | Prater Shawna C | $80,750 |
Source: Public Records
Tax History Compared to Growth
Tax History
| Year | Tax Paid | Tax Assessment Tax Assessment Total Assessment is a certain percentage of the fair market value that is determined by local assessors to be the total taxable value of land and additions on the property. | Land | Improvement |
|---|---|---|---|---|
| 2025 | $2,596 | $81,800 | $21,500 | $60,300 |
| 2024 | $2,529 | $77,300 | $20,500 | $56,800 |
| 2023 | $2,529 | $72,400 | $20,100 | $52,300 |
| 2022 | $2,444 | $62,400 | $18,900 | $43,500 |
| 2021 | $2,339 | $59,700 | $18,700 | $41,000 |
| 2020 | $2,292 | $55,900 | $18,700 | $37,200 |
| 2019 | $2,222 | $52,100 | $17,600 | $34,500 |
| 2018 | $2,103 | $46,500 | $20,300 | $26,200 |
| 2017 | $2,042 | $47,100 | $22,100 | $25,000 |
| 2016 | $878 | $49,600 | $21,300 | $28,300 |
| 2015 | $878 | $44,900 | $32,026 | $12,874 |
| 2014 | $878 | $36,900 | $17,000 | $19,900 |
Source: Public Records
Map
Nearby Homes
- 1664 Pepper Ridge Dr
- 5993 Greenman St
- 5987 Martinus St
- 1766 Lake Lansing Rd
- 5934 Montebello Ave
- 5906 Marsh Rd
- Lot B Lake Lansing Rd
- Lot A Lake Lansing Rd
- 5880 Shaw St
- 6248 W Reynolds Rd
- 1840 Lyndhurst Way
- 1922 Lac Du Mont Unit 3
- 1779 Baker St
- 1996 Lac Du Mont
- 1827 Towner Rd
- 6370 Royal Oak Dr
- 5965 Village Dr
- 5837 Carlton St
- 2037 Lac Du Mont Unit 41
- 5953 Village Dr
- 6006 Cypress St
- 1700 Buckthorn Dr
- 1684 Pepper Ridge Dr
- 6003 Harvey St
- 6003 Cypress St
- 1678 Pepper Ridge Dr
- 5997 Cypress St
- 6014 Greenman St
- 5999 Harvey St
- 5994 Cypress St
- 6004 Greenman St
- 1672 Pepper Ridge Dr
- 5989 Cypress St
- 6000 Greenman St
- 5990 Cypress St
- 5992 Harvey St
- 5992 Greenman St
- 6013 Greenman St
- 6009 Greenman St