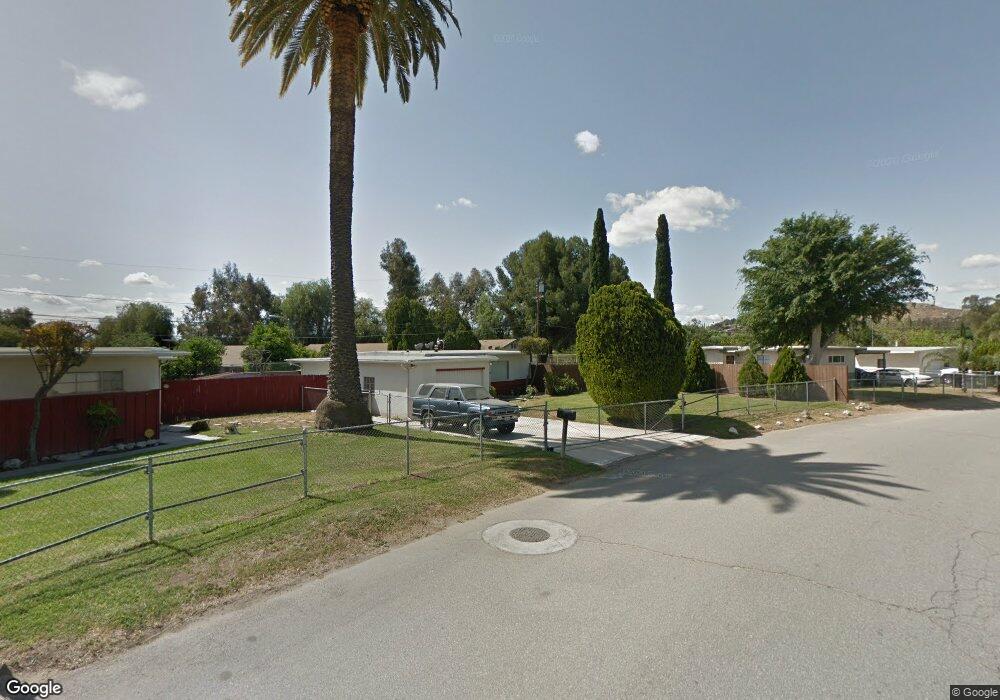
6010 Sky Meadow St Riverside, CA 92509
Rubidoux NeighborhoodEstimated Value: $507,000 - $547,000
3
Beds
2
Baths
1,205
Sq Ft
$434/Sq Ft
Est. Value
About This Home
This home is located at 6010 Sky Meadow St, Riverside, CA 92509 and is currently estimated at $522,972, approximately $434 per square foot. 6010 Sky Meadow St is a home located in Riverside County with nearby schools including West Riverside Elementary, Mission Middle School, and Rubidoux High School.
Ownership History
Date
Name
Owned For
Owner Type
Purchase Details
Closed on
May 19, 1998
Sold by
Hud
Bought by
Gladin Juan C and Gladin Maria E
Current Estimated Value
Home Financials for this Owner
Home Financials are based on the most recent Mortgage that was taken out on this home.
Original Mortgage
$52,566
Interest Rate
7.03%
Mortgage Type
FHA
Purchase Details
Closed on
Jul 25, 1997
Sold by
Roosevelt Bank
Bought by
Hud
Purchase Details
Closed on
Jan 6, 1997
Sold by
Ena Gorey Ronald E
Bought by
Roosevelt Bank
Purchase Details
Closed on
Jun 11, 1996
Sold by
Gorey and Ena
Bought by
Sky Property Mtg Service
Purchase Details
Closed on
Jan 15, 1996
Sold by
Gorey Ronald E and Gorey Dona L
Bought by
Gorey Ronald and Gorey Ena
Home Financials for this Owner
Home Financials are based on the most recent Mortgage that was taken out on this home.
Original Mortgage
$25,000
Interest Rate
7.18%
Mortgage Type
Purchase Money Mortgage
Create a Home Valuation Report for This Property
The Home Valuation Report is an in-depth analysis detailing your home's value as well as a comparison with similar homes in the area
Home Values in the Area
Average Home Value in this Area
Purchase History
| Date | Buyer | Sale Price | Title Company |
|---|---|---|---|
| Gladin Juan C | $53,000 | Lawyers Title Company | |
| Hud | -- | Lawyers Title Company | |
| Roosevelt Bank | $124,694 | Continental Lawyers Title Co | |
| Sky Property Mtg Service | -- | -- | |
| Gorey Ronald | -- | Stewart Title |
Source: Public Records
Mortgage History
| Date | Status | Borrower | Loan Amount |
|---|---|---|---|
| Previous Owner | Gladin Juan C | $52,566 | |
| Previous Owner | Gorey Ronald | $25,000 |
Source: Public Records
Tax History
| Year | Tax Paid | Tax Assessment Tax Assessment Total Assessment is a certain percentage of the fair market value that is determined by local assessors to be the total taxable value of land and additions on the property. | Land | Improvement |
|---|---|---|---|---|
| 2025 | $990 | $83,061 | $39,179 | $43,882 |
| 2023 | $990 | $79,837 | $37,658 | $42,179 |
| 2022 | $956 | $78,272 | $36,920 | $41,352 |
| 2021 | $954 | $76,739 | $36,197 | $40,542 |
| 2020 | $944 | $75,953 | $35,826 | $40,127 |
| 2019 | $925 | $74,465 | $35,124 | $39,341 |
| 2018 | $896 | $73,006 | $34,437 | $38,569 |
| 2017 | $887 | $71,575 | $33,762 | $37,813 |
| 2016 | $874 | $70,172 | $33,100 | $37,072 |
| 2015 | $862 | $69,119 | $32,603 | $36,516 |
| 2014 | $808 | $67,766 | $31,965 | $35,801 |
Source: Public Records
Map
Nearby Homes
- 5970 Sky Meadow St
- 0 42nd St
- 5754 Tilton Ave
- 5748 Tilton Ave
- 4077 Riverview Dr
- 5934 Mission Blvd
- 4598 Plaza Ln
- 0 Plaza Ln
- 5956 Mission Blvd
- 5803 Mission Blvd
- 0 Mission Blvd Unit IG25268475
- 0 Mission Blvd Unit PW25275749
- 0 Mission Blvd Unit IV23139894
- 3934 Pontiac Ave
- 6000 Limonite Ave
- 6154 Mission Blvd Unit 65
- 6154 Mission Blvd Unit 3
- 3634 Pioneer Dr
- 3895 Twining St
- 3350 Jennie St
- 6002 Sky Meadow St
- 5784 Vista de Oro
- 5786 Vista de Oro
- 5994 Sky Meadow St
- 5788 Vista de Oro
- 5986 Sky Meadow St
- 5782 Vista de Oro
- 5991 Sky Meadow St
- 5978 Sky Meadow St
- 5981 Sky Meadow St
- 5790 Vista de Oro
- 5780 Vista de Oro
- 5783 Vista de Oro
- 4285 Noyer Ln
- 5787 Vista de Oro
- 4277 Noyer Ln
- 5792 Vista de Oro
- 5789 Vista de Oro
- 5778 Vista de Oro
- 5962 Sky Meadow St
Your Personal Tour Guide
Ask me questions while you tour the home.