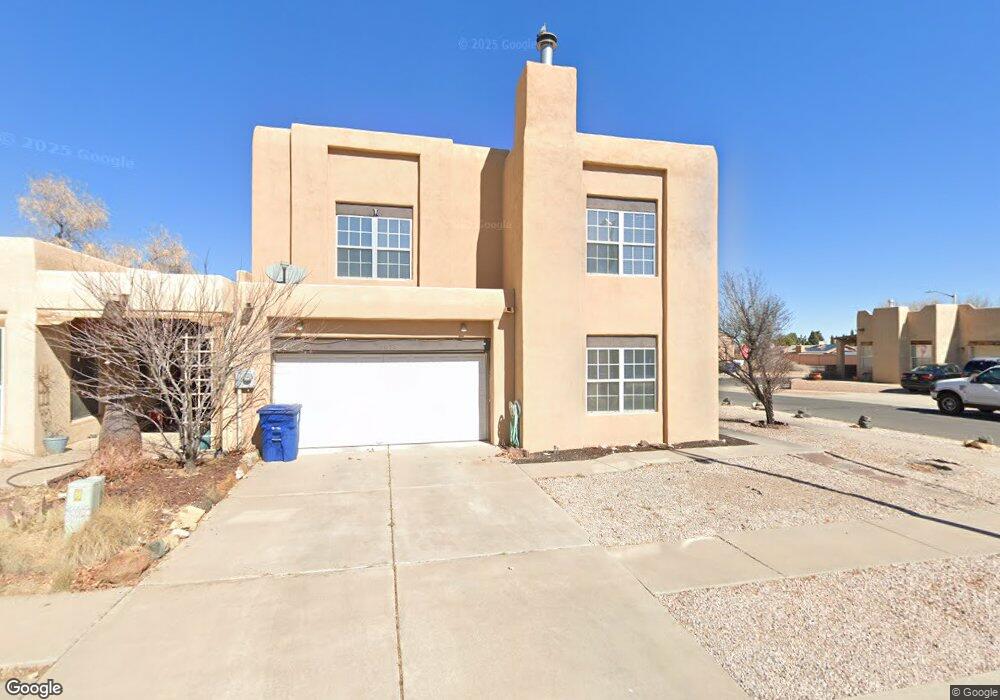
6015 Cardigan Ct NW Albuquerque, NM 87120
Taylor Ranch NeighborhoodEstimated Value: $327,000 - $351,000
3
Beds
3
Baths
1,813
Sq Ft
$186/Sq Ft
Est. Value
About This Home
This home is located at 6015 Cardigan Ct NW, Albuquerque, NM 87120 and is currently estimated at $337,418, approximately $186 per square foot. 6015 Cardigan Ct NW is a home located in Bernalillo County with nearby schools including Marie M. Hughes Elementary School, L.B. Johnson Middle School, and Volcano Vista High School.
Ownership History
Date
Name
Owned For
Owner Type
Purchase Details
Closed on
Jun 6, 2008
Sold by
Primacy Closing Corp
Bought by
Keelin Susan R
Current Estimated Value
Home Financials for this Owner
Home Financials are based on the most recent Mortgage that was taken out on this home.
Original Mortgage
$145,600
Outstanding Balance
$93,526
Interest Rate
6.07%
Mortgage Type
Purchase Money Mortgage
Estimated Equity
$243,892
Purchase Details
Closed on
Aug 18, 2006
Sold by
Gaines Nancy M
Bought by
Gossum Sara L
Home Financials for this Owner
Home Financials are based on the most recent Mortgage that was taken out on this home.
Original Mortgage
$166,000
Interest Rate
6%
Mortgage Type
New Conventional
Purchase Details
Closed on
Jun 16, 1999
Sold by
Carnes C Patrick and Carnes Sandra L
Bought by
Gaines Demetrius and Gaines Nancy
Home Financials for this Owner
Home Financials are based on the most recent Mortgage that was taken out on this home.
Original Mortgage
$137,900
Interest Rate
8.75%
Create a Home Valuation Report for This Property
The Home Valuation Report is an in-depth analysis detailing your home's value as well as a comparison with similar homes in the area
Home Values in the Area
Average Home Value in this Area
Purchase History
| Date | Buyer | Sale Price | Title Company |
|---|---|---|---|
| Keelin Susan R | -- | Rio Grande Title Co Inc | |
| Gossum Sara L | -- | Stewart Title | |
| Gaines Demetrius | -- | First American Title Co | |
| Gaines Demetris | $144,900 | -- |
Source: Public Records
Mortgage History
| Date | Status | Borrower | Loan Amount |
|---|---|---|---|
| Open | Keelin Susan R | $145,600 | |
| Previous Owner | Gossum Sara L | $166,000 | |
| Previous Owner | Gaines Demetris | $137,900 |
Source: Public Records
Tax History Compared to Growth
Tax History
| Year | Tax Paid | Tax Assessment Tax Assessment Total Assessment is a certain percentage of the fair market value that is determined by local assessors to be the total taxable value of land and additions on the property. | Land | Improvement |
|---|---|---|---|---|
| 2025 | $2,735 | $72,948 | $14,682 | $58,266 |
| 2024 | $2,735 | $70,824 | $14,255 | $56,569 |
| 2023 | $2,938 | $68,762 | $13,840 | $54,922 |
| 2022 | $2,839 | $66,759 | $13,437 | $53,322 |
| 2021 | $2,744 | $64,814 | $13,045 | $51,769 |
| 2020 | $2,699 | $62,927 | $12,665 | $50,262 |
| 2019 | $2,725 | $63,547 | $14,255 | $49,292 |
| 2018 | $2,628 | $63,547 | $14,255 | $49,292 |
| 2017 | $2,547 | $61,697 | $13,840 | $47,857 |
| 2016 | $2,474 | $58,154 | $13,045 | $45,109 |
| 2015 | $56,461 | $56,461 | $12,665 | $43,796 |
| 2014 | $2,419 | $56,961 | $12,665 | $44,296 |
| 2013 | -- | $57,494 | $12,665 | $44,829 |
Source: Public Records
Map
Nearby Homes
- 6101 Chimayo Dr NW
- 5901 Chimayo Dr NW
- 6005 Rio Pueblo Dr NW
- 6133 Flor de Mayo Place NW
- 5805 Chimayo Dr NW
- 5504 Hayes Dr NW
- 5609 Cambria Rd NW
- 6420 Pojoaque Rd NW
- 6304 Flor Del Sol Place NW
- 5305 Desert Sand Place NW
- 6020 Jamers Place NW
- 5432 Mariposa Dr NW
- 6616 Meadow Lake Place NW
- 6116 Agate Ave NW
- 0 Unser Blvd NW
- 5129 Camino Vista NW
- 5143 Gaviota NW
- 0 Santo Domingo St NW Unit 1072927
- 5429 Gold Rush Dr NW
- 5101 Tecolote NW
- 6019 Cardigan Ct NW
- 6023 Cardigan Ct NW
- 6000 Cardigan Ct NW
- 6004 Cardigan Ct NW
- 6020 Cardigan Ct NW
- 6016 Cardigan Ct NW
- 6027 Cardigan Ct NW
- 6009 Kiva St NW
- 6008 Cardigan Ct NW
- 6005 Kiva St NW
- 6013 Kiva St NW
- 6028 Cardigan Ct NW
- 6031 Cardigan Ct NW
- 6017 Kiva St NW
- 6001 Kiva St NW
- 6032 Cardigan Ct NW
- 6021 Kiva St NW
- 6035 Cardigan Ct NW
- 6008 Bear Claw Rd NW
- 6012 Bear Claw Rd NW