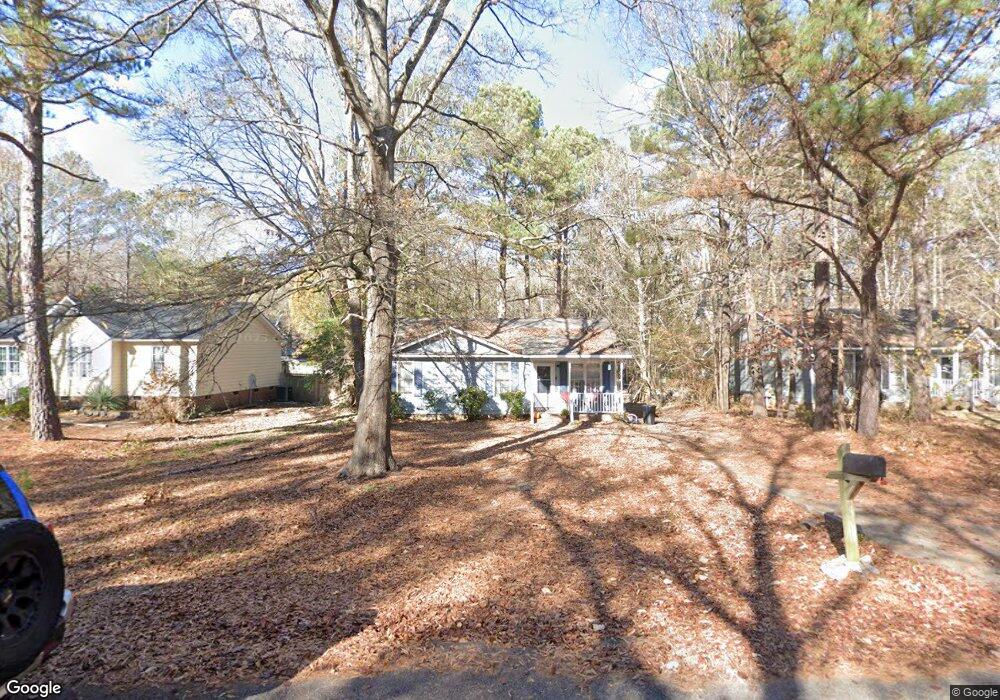
6017 Antigua Run Knightdale, NC 27545
Shotwell NeighborhoodEstimated Value: $256,000 - $278,000
3
Beds
2
Baths
1,017
Sq Ft
$260/Sq Ft
Est. Value
About This Home
This home is located at 6017 Antigua Run, Knightdale, NC 27545 and is currently estimated at $264,038, approximately $259 per square foot. 6017 Antigua Run is a home located in Wake County with nearby schools including Lake Myra Elementary, Wendell Middle School, and East Wake High School.
Ownership History
Date
Name
Owned For
Owner Type
Purchase Details
Closed on
Jul 13, 2012
Sold by
Evans Katie J Hiller and Evans Damon R
Bought by
Evans Investment Group Llc
Current Estimated Value
Purchase Details
Closed on
Aug 2, 2004
Sold by
Bank One Na
Bought by
Hillier Katie J
Home Financials for this Owner
Home Financials are based on the most recent Mortgage that was taken out on this home.
Original Mortgage
$69,451
Outstanding Balance
$34,987
Interest Rate
6.24%
Mortgage Type
FHA
Estimated Equity
$229,051
Purchase Details
Closed on
Jan 6, 2004
Sold by
Hargrove Queen E
Bought by
Bank One Na
Purchase Details
Closed on
Jul 16, 1999
Sold by
Hargrove Johnnie F
Bought by
Hargrove Queen E
Home Financials for this Owner
Home Financials are based on the most recent Mortgage that was taken out on this home.
Original Mortgage
$95,125
Interest Rate
7.43%
Create a Home Valuation Report for This Property
The Home Valuation Report is an in-depth analysis detailing your home's value as well as a comparison with similar homes in the area
Home Values in the Area
Average Home Value in this Area
Purchase History
| Date | Buyer | Sale Price | Title Company |
|---|---|---|---|
| Evans Investment Group Llc | -- | None Available | |
| Hillier Katie J | $70,000 | -- | |
| Bank One Na | $74,154 | -- | |
| Hargrove Queen E | -- | -- |
Source: Public Records
Mortgage History
| Date | Status | Borrower | Loan Amount |
|---|---|---|---|
| Open | Hillier Katie J | $69,451 | |
| Previous Owner | Hargrove Queen E | $95,125 |
Source: Public Records
Tax History Compared to Growth
Tax History
| Year | Tax Paid | Tax Assessment Tax Assessment Total Assessment is a certain percentage of the fair market value that is determined by local assessors to be the total taxable value of land and additions on the property. | Land | Improvement |
|---|---|---|---|---|
| 2025 | $1,413 | $217,818 | $70,000 | $147,818 |
| 2024 | $1,373 | $217,818 | $70,000 | $147,818 |
| 2023 | $1,116 | $140,550 | $30,000 | $110,550 |
| 2022 | $1,035 | $140,550 | $30,000 | $110,550 |
| 2021 | $1,008 | $140,550 | $30,000 | $110,550 |
| 2020 | $991 | $140,550 | $30,000 | $110,550 |
| 2019 | $859 | $102,682 | $28,500 | $74,182 |
| 2018 | $791 | $102,682 | $28,500 | $74,182 |
| 2017 | $750 | $102,682 | $28,500 | $74,182 |
| 2016 | $735 | $102,682 | $28,500 | $74,182 |
| 2015 | $744 | $104,244 | $30,000 | $74,244 |
| 2014 | $706 | $104,244 | $30,000 | $74,244 |
Source: Public Records
Map
Nearby Homes
- 1132 Amber Acres Ln
- 1112 Amber Acres Ln
- 1016 Windward Passage
- 1985 Big Falls Dr
- 733 Daniel Ridge Rd
- 445 Douglas Falls Dr
- 1189 Cottonsprings Dr
- 305 Sunset Hill Ln
- Park Ave Plan at Wendell Falls - Townhome Collection
- Manhattan Plan at Wendell Falls - Townhome Collection
- Greenwich Plan at Wendell Falls - Townhome Collection
- Lincoln Plan at Wendell Falls - Townhome Collection
- Scissors Plan at Wendell Falls - Roshambo Collection
- Found a Dream Plan at Wendell Falls - Playlist Collection
- Paper Plan at Wendell Falls - Roshambo Collection
- Shoot Plan at Wendell Falls - Roshambo Collection
- Southbound Train Plan at Wendell Falls - Playlist Collection
- Castle in Brooklyn Plan at Wendell Falls - Playlist Collection
- Tiebreaker Plan at Wendell Falls - Roshambo Collection
- Rock Plan at Wendell Falls - Roshambo Collection
- 6013 Antigua Run
- 6025 Antigua Run
- 6009 Antigua Run
- 6029 Antigua Run
- 1221 Amber Acres Ln
- 6020 Antigua Run
- 6024 Antigua Run
- 6033 Antigua Run
- 1217 Amber Acres Ln
- 6028 Antigua Run
- 6012 Antigua Run
- 6032 Antigua Run
- 6008 Antigua Run
- 6037 Antigua Run
- 6040 Antigua Run
- 1224 Amber Acres Ln
- 6041 Antigua Run
- 1309 Amber Acres Ln
- 1209 Amber Acres Ln
- 6044 Antigua Run