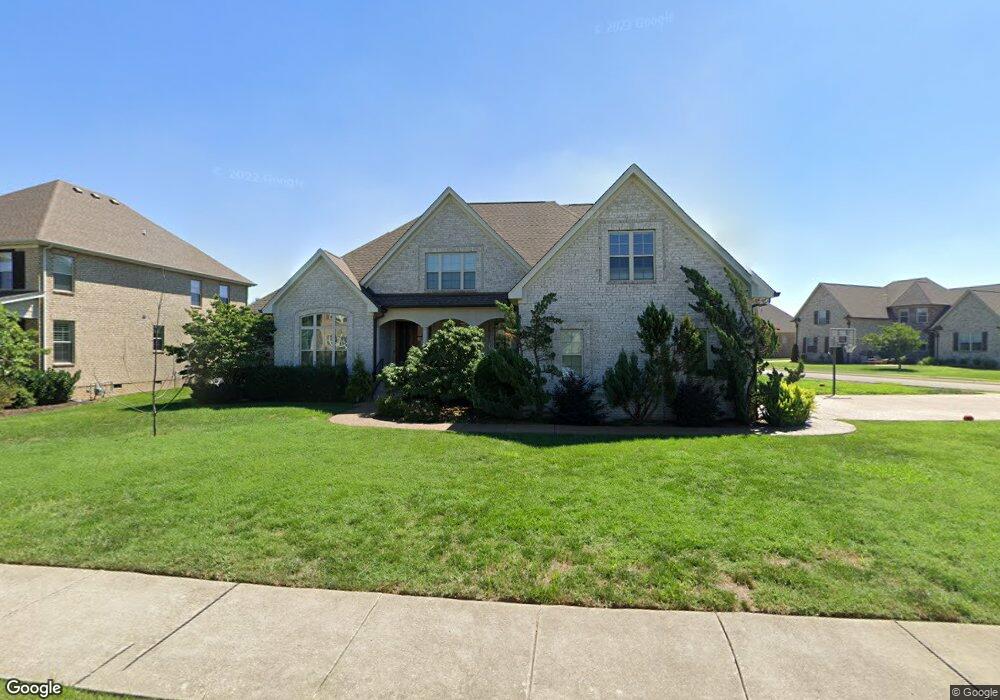
6017 Trout Ln Spring Hill, TN 37174
Estimated Value: $906,125 - $1,040,000
4
Beds
4
Baths
3,534
Sq Ft
$273/Sq Ft
Est. Value
About This Home
This home is located at 6017 Trout Ln, Spring Hill, TN 37174 and is currently estimated at $966,531, approximately $273 per square foot. 6017 Trout Ln is a home located in Williamson County with nearby schools including Primrose School of Spring Hill and Columbia Academy at Spring Hill.
Ownership History
Date
Name
Owned For
Owner Type
Purchase Details
Closed on
Mar 3, 2014
Sold by
R G Custom Homes Llc
Bought by
Shaw Jared and Shaw Sherri
Current Estimated Value
Home Financials for this Owner
Home Financials are based on the most recent Mortgage that was taken out on this home.
Original Mortgage
$329,925
Outstanding Balance
$250,923
Interest Rate
4.43%
Mortgage Type
New Conventional
Estimated Equity
$715,608
Purchase Details
Closed on
Feb 14, 2014
Sold by
Ray Michael and Ray Peggy
Bought by
Rg Custom Homes Llc
Home Financials for this Owner
Home Financials are based on the most recent Mortgage that was taken out on this home.
Original Mortgage
$329,925
Outstanding Balance
$250,923
Interest Rate
4.43%
Mortgage Type
New Conventional
Estimated Equity
$715,608
Purchase Details
Closed on
Jun 7, 2013
Sold by
Cameron Dpm R
Bought by
Ray Michael and Ray Peggy
Home Financials for this Owner
Home Financials are based on the most recent Mortgage that was taken out on this home.
Original Mortgage
$348,000
Interest Rate
3.43%
Mortgage Type
Purchase Money Mortgage
Create a Home Valuation Report for This Property
The Home Valuation Report is an in-depth analysis detailing your home's value as well as a comparison with similar homes in the area
Home Values in the Area
Average Home Value in this Area
Purchase History
| Date | Buyer | Sale Price | Title Company |
|---|---|---|---|
| Shaw Jared | $440,900 | Mid State Title & Escrow | |
| Rg Custom Homes Llc | -- | Mid State Title & Escrow | |
| Ray Michael | $85,000 | None Available |
Source: Public Records
Mortgage History
| Date | Status | Borrower | Loan Amount |
|---|---|---|---|
| Open | Shaw Jared | $329,925 | |
| Previous Owner | Ray Michael | $348,000 |
Source: Public Records
Tax History Compared to Growth
Tax History
| Year | Tax Paid | Tax Assessment Tax Assessment Total Assessment is a certain percentage of the fair market value that is determined by local assessors to be the total taxable value of land and additions on the property. | Land | Improvement |
|---|---|---|---|---|
| 2024 | $1,109 | $150,025 | $30,000 | $120,025 |
| 2023 | $1,109 | $150,025 | $30,000 | $120,025 |
| 2022 | $2,745 | $150,025 | $30,000 | $120,025 |
| 2021 | $2,745 | $150,025 | $30,000 | $120,025 |
| 2020 | $2,600 | $120,375 | $23,750 | $96,625 |
| 2019 | $2,600 | $120,375 | $23,750 | $96,625 |
| 2018 | $2,516 | $120,375 | $23,750 | $96,625 |
| 2017 | $2,492 | $120,375 | $23,750 | $96,625 |
| 2016 | $0 | $120,375 | $23,750 | $96,625 |
| 2015 | -- | $106,675 | $21,250 | $85,425 |
| 2014 | -- | $86,825 | $21,250 | $65,575 |
Source: Public Records
Map
Nearby Homes
- 3007 Arbuckle Ln
- 1816 Witt Way Dr
- 5004 Paint Creek Ct
- 8027 Puddleduck Ln
- 1022 Gadwall Ln
- 1816 Elizabeth Ct
- 3005 Turnstone Trace
- 1013 Gadwall Ln
- 4050 Kiskadee Ln
- 1030 Gadwall Ln
- 920 Carnation Dr
- 1050 Gadwall Ln
- 1052 Gadwall Ln
- 2022 Kestrel Ln
- 1025 Cantwell Place
- 3041 Everleigh Place
- 422 Bruce Dr
- 806 Belle Dr
- 2040 Belshire Way
- 156 Dalton Cir
- 6015 Trout Ln
- 1794 Witt Way Dr
- 1794 Witt Way Dr
- 1795 Witt Way Dr
- 1797 Witt Way Dr
- 6016 Trout Ln
- 6018 Trout Ln
- 1793 Witt Way Dr
- 1792 Witt Way Dr
- 1793 Witt Way Dr
- 1793 Witt Way Dr
- 1792 Witt Way Dr
- 3015 Arbuckle Ln
- 6014 Trout Ln
- 1799 Witt Way Dr
- 4002 Cardigan Ln
- 1790 Witt Way Dr
- 1790 Witt Way Dr
- 1790 Witt Way Dr
- 3011 Arbuckle Ln