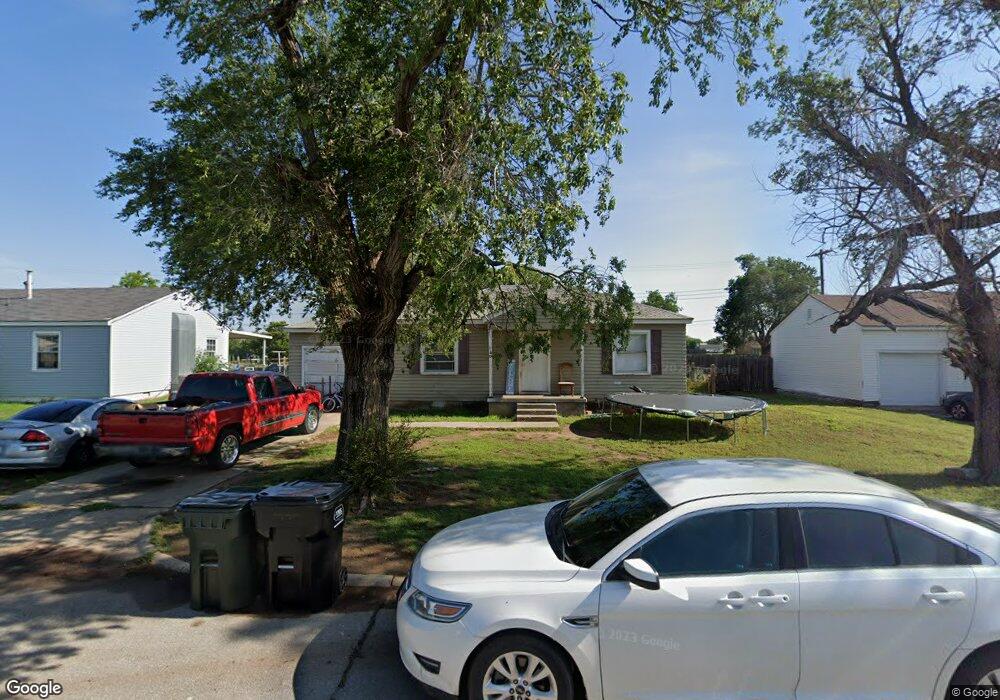
602 Circle Dr Watonga, OK 73772
Estimated Value: $49,462 - $71,000
2
Beds
1
Bath
816
Sq Ft
$73/Sq Ft
Est. Value
About This Home
This home is located at 602 Circle Dr, Watonga, OK 73772 and is currently estimated at $59,616, approximately $73 per square foot. 602 Circle Dr is a home located in Blaine County with nearby schools including Watonga Elementary School, Watonga Middle School, and Watonga High School.
Ownership History
Date
Name
Owned For
Owner Type
Purchase Details
Closed on
Oct 29, 2010
Sold by
Blair Lane and Blair Susan P
Bought by
Stine Rebecca A
Current Estimated Value
Home Financials for this Owner
Home Financials are based on the most recent Mortgage that was taken out on this home.
Original Mortgage
$40,912
Outstanding Balance
$29,080
Interest Rate
4.41%
Mortgage Type
Unknown
Estimated Equity
$30,536
Purchase Details
Closed on
Jan 13, 2009
Sold by
Gabe Ronald W and Gabe Cynthia K
Bought by
Blair Lane and Blair Susan P
Home Financials for this Owner
Home Financials are based on the most recent Mortgage that was taken out on this home.
Original Mortgage
$25,000
Interest Rate
5.48%
Mortgage Type
Unknown
Purchase Details
Closed on
Jan 14, 1999
Sold by
Justice Herman and Justice Eunice
Bought by
Gabe Ron
Purchase Details
Closed on
May 16, 1997
Sold by
Cunningham Chester
Bought by
Justice Herman O Rev Trt
Create a Home Valuation Report for This Property
The Home Valuation Report is an in-depth analysis detailing your home's value as well as a comparison with similar homes in the area
Home Values in the Area
Average Home Value in this Area
Purchase History
| Date | Buyer | Sale Price | Title Company |
|---|---|---|---|
| Stine Rebecca A | $39,000 | -- | |
| Blair Lane | $21,000 | -- | |
| Gabe Ron | $22,000 | -- | |
| Justice Herman O Rev Trt | $22,000 | -- |
Source: Public Records
Mortgage History
| Date | Status | Borrower | Loan Amount |
|---|---|---|---|
| Open | Stine Rebecca A | $40,912 | |
| Previous Owner | Blair Lane | $25,000 |
Source: Public Records
Tax History
| Year | Tax Paid | Tax Assessment Tax Assessment Total Assessment is a certain percentage of the fair market value that is determined by local assessors to be the total taxable value of land and additions on the property. | Land | Improvement |
|---|---|---|---|---|
| 2025 | $228 | $3,205 | $503 | $2,702 |
| 2024 | $196 | $3,021 | $501 | $2,520 |
| 2023 | $188 | $2,933 | $501 | $2,432 |
| 2022 | $201 | $2,848 | $501 | $2,347 |
| 2021 | $174 | $2,765 | $500 | $2,265 |
| 2020 | $164 | $2,685 | $446 | $2,239 |
| 2019 | $160 | $2,606 | $498 | $2,108 |
| 2018 | $161 | $2,552 | $766 | $1,786 |
| 2017 | $203 | $2,902 | $247 | $2,655 |
| 2016 | $218 | $2,929 | $247 | $2,682 |
| 2015 | $194 | $2,920 | $247 | $2,673 |
| 2014 | $148 | $2,835 | $247 | $2,588 |
Source: Public Records
Map
Nearby Homes
- 632 Circle Dr
- 515 W 4th St
- 502 W 4th St
- 419 N Harmon Ave
- 415 N Harmon Ave
- 615 & 617 N Wikoff
- 403 N Harmon Ave
- 319 N Wikoff Ave
- 323 W 3rd St
- 401 N Leach Ave
- 320 W 2nd St
- 826 Hillcrest Dr
- 309 W 2nd St
- 1007 N Market Ave
- 521 N Noble Ave
- 100 W 3rd St
- 114 N Leach Ave Unit 116 118 & 120 N Leac
- 924 N Prouty Ave
- 501 Northampton Dr
- 1009 N Noble Ave
- 604 Circle Dr
- 600 Circle Dr
- 606 Circle Dr
- 603 Circle Dr
- 605 Circle Dr
- 601 Circle Dr
- 608 Circle Dr
- 607 Circle Dr
- 600 N Clarence Nash Blvd
- 609 Circle Dr
- 630 Circle Dr
- 628 Circle Dr
- 610 Circle Dr
- 624 Circle Dr
- 611 Circle Dr
- 612 Circle Dr
- 701 N Clarence Nash Blvd
- 613 Circle Dr
- 622 Circle Dr
- 631 Circle Dr
Your Personal Tour Guide
Ask me questions while you tour the home.