C
Landlord's Agent in 2025
Cherie Kelly
BHHS FLORIDA PROPERTIES GROUP
(727) 461-1700
11 Total Sales
Estimated Value: $443,103 - $516,000
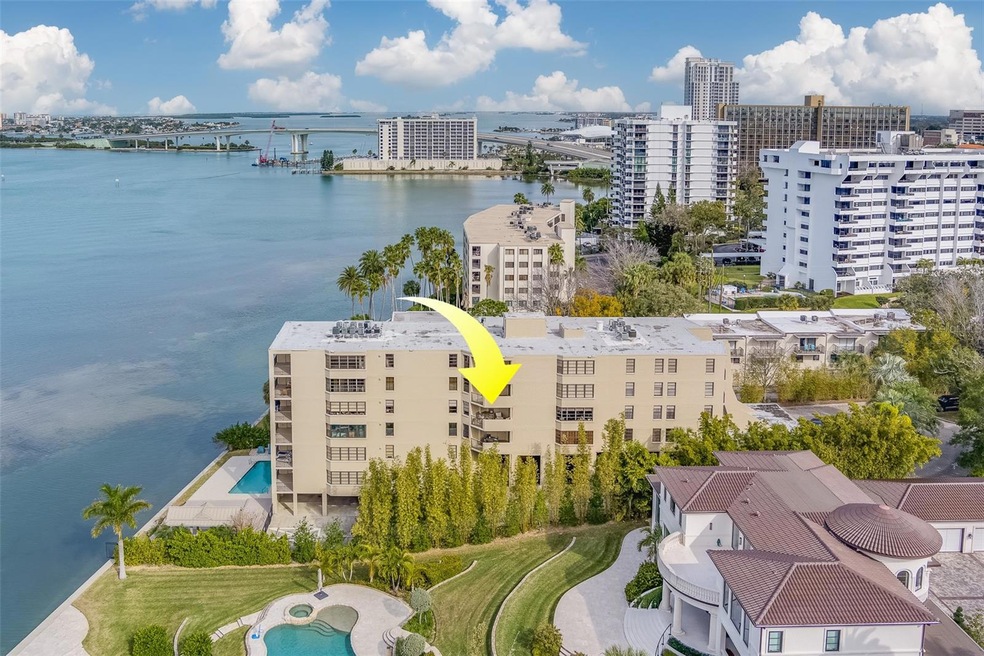
This upgraded condo overlooks the INTRACOASTAL WATERWAY offering breathtaking views and is immaculately maintained! Welcome to Camelot Oaks Condos nestled behind stunning palm trees and landscaping. This unit has a private parking space, storage room, and a pool facing the stunning water views. There is no better way to spend your Florida days. There is ultimate privacy and serenity with a total of 6 floors and 21 units. With a generous 1,400 square foot unit, this condo offers 2 large bedrooms, 2 full bathrooms, and a private balcony. Enjoy sitting on the balcony day in and day out seeing nothing but the glistening Intracoastal Waterway and Clearwater Harbor. Relish the grand living room space connecting to the balcony. Open the sliding doors and let the in the sea breeze. Camelot Oaks has a high-end lobby for gatherings, sparkling community pool with nothing but water views, covered deck area, indoor kitchen area by the pool, elevators, garbage shoot, private storage unit, and private parking space. The condo fees include basic cable, water, and trash! Location! Location! Location! Minutes away from CLEARWATER BEACH, grocery, shopping, dining, hospitals, close to Tampa International Airport, and more!
Last Agent to Rent the Property
BHHS FLORIDA PROPERTIES GROUP Brokerage Phone: 727-461-1700 License #3267604 Listed on: 01/24/2024

Last Renter's Agent
BHHS FLORIDA PROPERTIES GROUP Brokerage Phone: 727-461-1700 License #3267604 Listed on: 01/24/2024
| Date | Buyer | Sale Price | Title Company |
|---|---|---|---|
| Manning Tina Renee Thomas | $410,000 | Total Title Solutions Llc |
| Date | Event | Price | List to Sale | Price per Sq Ft | Prior Sale |
|---|---|---|---|---|---|
| 01/02/2025 01/02/25 | Rented | $4,000 | +14.3% | -- | |
| 11/12/2024 11/12/24 | For Rent | $3,500 | 0.0% | -- | |
| 11/06/2024 11/06/24 | Off Market | $3,500 | -- | -- | |
| 04/22/2024 04/22/24 | Price Changed | $3,500 | -2.8% | $3 / Sq Ft | |
| 03/21/2024 03/21/24 | Price Changed | $3,600 | -1.4% | $3 / Sq Ft | |
| 01/24/2024 01/24/24 | For Rent | $3,650 | 0.0% | -- | |
| 12/10/2021 12/10/21 | Sold | $410,000 | -3.5% | $293 / Sq Ft | View Prior Sale |
| 11/21/2021 11/21/21 | Pending | -- | -- | -- | |
| 11/15/2021 11/15/21 | Price Changed | $425,000 | -5.6% | $304 / Sq Ft | |
| 10/22/2021 10/22/21 | Price Changed | $450,000 | -3.2% | $321 / Sq Ft | |
| 09/23/2021 09/23/21 | For Sale | $465,000 | -- | $332 / Sq Ft |
| Year | Tax Paid | Tax Assessment Tax Assessment Total Assessment is a certain percentage of the fair market value that is determined by local assessors to be the total taxable value of land and additions on the property. | Land | Improvement |
|---|---|---|---|---|
| 2024 | $7,266 | $382,129 | -- | $382,129 |
| 2023 | $7,266 | $394,993 | $0 | $394,993 |
| 2022 | $6,503 | $335,366 | $0 | $335,366 |
| 2021 | $4,968 | $244,456 | $0 | $0 |
| 2020 | $4,894 | $237,705 | $0 | $0 |
| 2019 | $4,657 | $227,541 | $0 | $227,541 |
| 2018 | $4,311 | $213,545 | $0 | $0 |
| 2017 | $3,761 | $184,205 | $0 | $0 |
| 2016 | $1,159 | $97,596 | $0 | $0 |
| 2015 | $1,177 | $96,918 | $0 | $0 |
| 2014 | $1,167 | $96,149 | $0 | $0 |
C
Landlord's Agent in 2025
Cherie Kelly
BHHS FLORIDA PROPERTIES GROUP
(727) 461-1700
11 Total Sales
Seller's Agent in 2021
Joe Bennett
REAL BROKER, LLC
(863) 840-1020
143 Total Sales
Buyer's Agent in 2021
Nibal Elsaadi
BHHS FLORIDA PROPERTIES GROUP
(813) 215-4522
47 Total Sales
Source: Stellar MLS
MLS Number: U8228112
APN: 16-29-15-12993-000-4040
Disclaimer: Certain information contained herein is derived from information provided by parties other than Homes.com. All information provided is deemed reliable, but is not guaranteed to be accurate and should be independently verified.
![]() IDX information is provided exclusively for personal, non-commercial use, and may not be used for any purpose other than to identify prospective properties consumers may be interested in purchasing. Information is deemed reliable but not guaranteed.
IDX information is provided exclusively for personal, non-commercial use, and may not be used for any purpose other than to identify prospective properties consumers may be interested in purchasing. Information is deemed reliable but not guaranteed.
Listing Information presented by local MLS brokerage: Ten-X - (888)-952-6393